add ganglia metrics to gold tables
Our main goal of adding overwatch is to estimate the under-utilization of cluster as shown in ganglia UI . It will be highly great if we can have the data stored as table or it will be highly helpful if we get the underutilization of a cluster. Say during this time it is 50% utilized then 70% utilized etc..
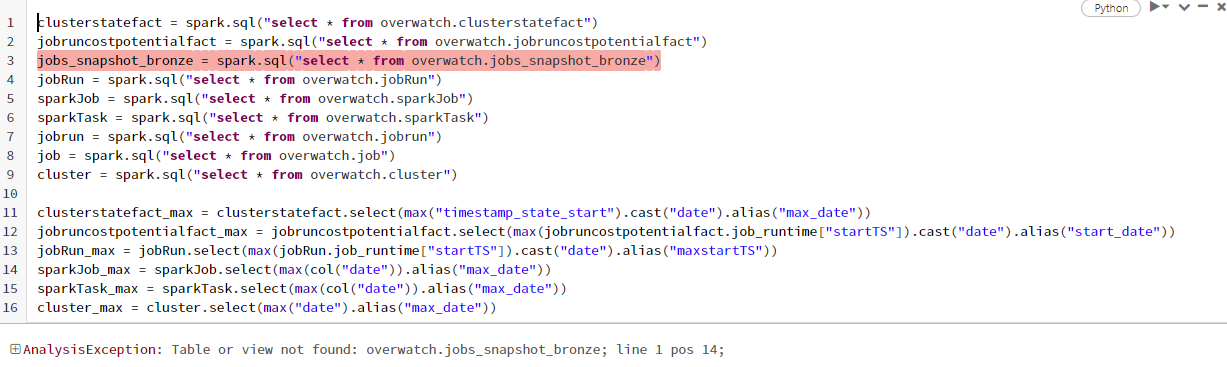
clusterstatefact = spark.sql("select * from overwatch.clusterstatefact") jobruncostpotentialfact = spark.sql("select * from overwatch.jobruncostpotentialfact") jobs_snapshot_bronze = spark.sql("select * from overwatch_etl.jobs_snapshot_bronze") jobRun = spark.sql("select * from overwatch.jobRun") sparkJob = spark.sql("select * from overwatch.sparkJob") sparkTask = spark.sql("select * from overwatch.sparkTask") jobrun = spark.sql("select * from overwatch.jobrun") job = spark.sql("select * from overwatch.job") cluster = spark.sql("select * from overwatch.cluster")
clusterstatefact_max = clusterstatefact.select(max("timestamp_state_start").cast("date").alias("max_date")) jobruncostpotentialfact_max = jobruncostpotentialfact.select(max(jobruncostpotentialfact.job_runtime["startTS"]).cast("date").alias("start_date")) jobRun_max = jobRun.select(max(jobRun.job_runtime["startTS"]).cast("date").alias("maxstartTS")) sparkJob_max = sparkJob.select(max(col("date")).alias("max_date")) sparkTask_max = sparkTask.select(max(col("date")).alias("max_date")) cluster_max = cluster.select(max("date").alias("max_date"))
--Cluster Utilisation for last 30 days (top 20) - Interactive
--Anti pattern highlighted: this highlights clusters that are simply, too big for the workloads on them. Consider downsizing to save on costs
--This shows the amount of wasted spend on clusters
Calculating the spark task usage time for the last 30 days
sptk = sparkTask
.join(sparkTask_max, sparkTask.date > sparkTask_max.max_date - 30, "inner")
.groupby("cluster_id")
.agg(sum(sparkTask.task_runtime['runTimeMS']).alias("usage_time_MS"))
.orderBy(sparkTask['date'].desc())
Filtering only interactive cluster
interactive_cluster = clusterstatefact
.withColumn("date", explode(col("state_dates")))
.where(col("isAutomated") == "false")
Calculating the total potential for charged billable state
db_billable_potential = interactive_cluster
.withColumn("total_potential",(interactive_cluster.worker_potential_core_H/interactive_cluster.days_in_state))
.where((col("databricks_billable") == "True"))\
.select("organization_id","cluster_id", "date","total_potential")
Calculation total cost for the cluster potential
db_billable_cost = db_billable_potential
.groupBy("organization_id", "cluster_id", "cluster_name")
.agg(round(sum(db_billable_potential["total_potential"]), 2).alias("cluster_potential (hrs)"),
round(sum(db_billable_potential["total_cost"]), 2).alias('total_cost (USD)'))
.select("organization_id",
"cluster_id",
"cluster_name",
"cluster_potential (hrs)",
"total_cost (USD)")
joining the billable cost details with spark task table
join_df = db_billable_cost.join(sptk, ((db_billable_cost.cluster_id == sptk.cluster_id)
), "inner")
.select(db_billable_cost.organization_id,
db_billable_cost.cluster_id,
db_billable_cost.cluster_name,
db_billable_cost['cluster_potential (hrs)'],
db_billable_cost['total_cost (USD)'],
sptk.usage_time_MS)
Calculating the cluster utilization
cluster_util = join_df
.withColumn('usage_time_H', round((join_df['usage_time_MS']/3600000), 2))
.withColumn('Utilization (%)', (round((((join_df.usage_time_MS/3600000)/join_df['cluster_potential (hrs)'])*100),2)))
Filtering particular columns
cluster_util_df = cluster_util.select('organization_id',
'cluster_id',
'cluster_name',
'cluster_potential (hrs)',
'total_cost (USD)',
'usage_time_H',
'Utilization (%)')
.orderBy(cluster_util['total_cost (USD)'].desc())
.limit(10)
Converting pyspark to pandas for visualization
utilize = cluster_util_df.toPandas()
Plotting dataframe view using plotly library
fig = px.bar(utilize, x="cluster_name", y = "total_cost (USD)", color_continuous_scale=["red", "green"], hover_data=["organization_id", "cluster_potential (hrs)", "usage_time_H", "Utilization (%)"], color="Utilization (%)", title="Cost over Interactive clusters utilization for last 30 days")
Visualizing the graph
fig.show()
This is an example for calculating cluster utilization, on top of that you can customize the code. We are planning to launch the advanced dashboard soon.
Under utilization can be determine with a query. @mohanbaabu1996 -- please provide the query.
Ganglia is going away to be replaced with better more modern tools; as such, we will not be moving Ganglia metrics into Overwatch.
@SomanathSankaran -- I realize the info above looks intimidating. Please note that we are working diligently to publish several of the more complicated queries, cluster utilization by hour is one of these such reports along with a myriad of others. They will be part of this repo and you can import them and use them. We are hoping to have this released in the next month or so. In the meantime, please reach out to @mohanbaabu1996 if you need more clarificaton
I am not sure if something I missed while collecting data . https://databrickslabs.github.io/overwatch/assets/GettingStarted/azure_runner_docs_example_060.html
I used this notebook to create the required tables.
Arguments passed for the same
val storagePrefix = "/mnt/overwatch_data".toLowerCase // PRIMARY OVERWATCH OUTPUT PREFIX val etlDB = "overwatch_etl".toLowerCase val consumerDB = "overwatch".toLowerCase val secretsScope = "OVERWATCH-SCOPE" val dbPATKey = "DBPAT" val ehName = "azdna-overwatch-eh" val ehKey = "EH-CONN-STRING" val primordialDateString = "2022-07-25" val maxDaysToLoad = 60 val scopes = "audit,sparkEvents,jobs,clusters,clusterEvents,notebooks,accounts".split(",") //val scopes = "jobs,clusters".split(",")
if (storagePrefix.isEmpty || consumerDB.isEmpty || etlDB.isEmpty || ehName.isEmpty || secretsScope.isEmpty || ehKey.isEmpty || dbPATKey.isEmpty) { throw new IllegalArgumentException("Please specify all required parameters!") }
Please let me know if I missed something while collecting the data
Hi @SomanathSankaran , Are you available at 12:30 PM IST today for a call ?
@SomanathSankaran I'm following up on this issue; I remember sending you the updated dashboard in order to fix the above issue. Please let me know if it works; if not, please reply to my email and I'll take it from there.
Thanks, Mohan Baabu