Add table of metric statistics to Workers tab
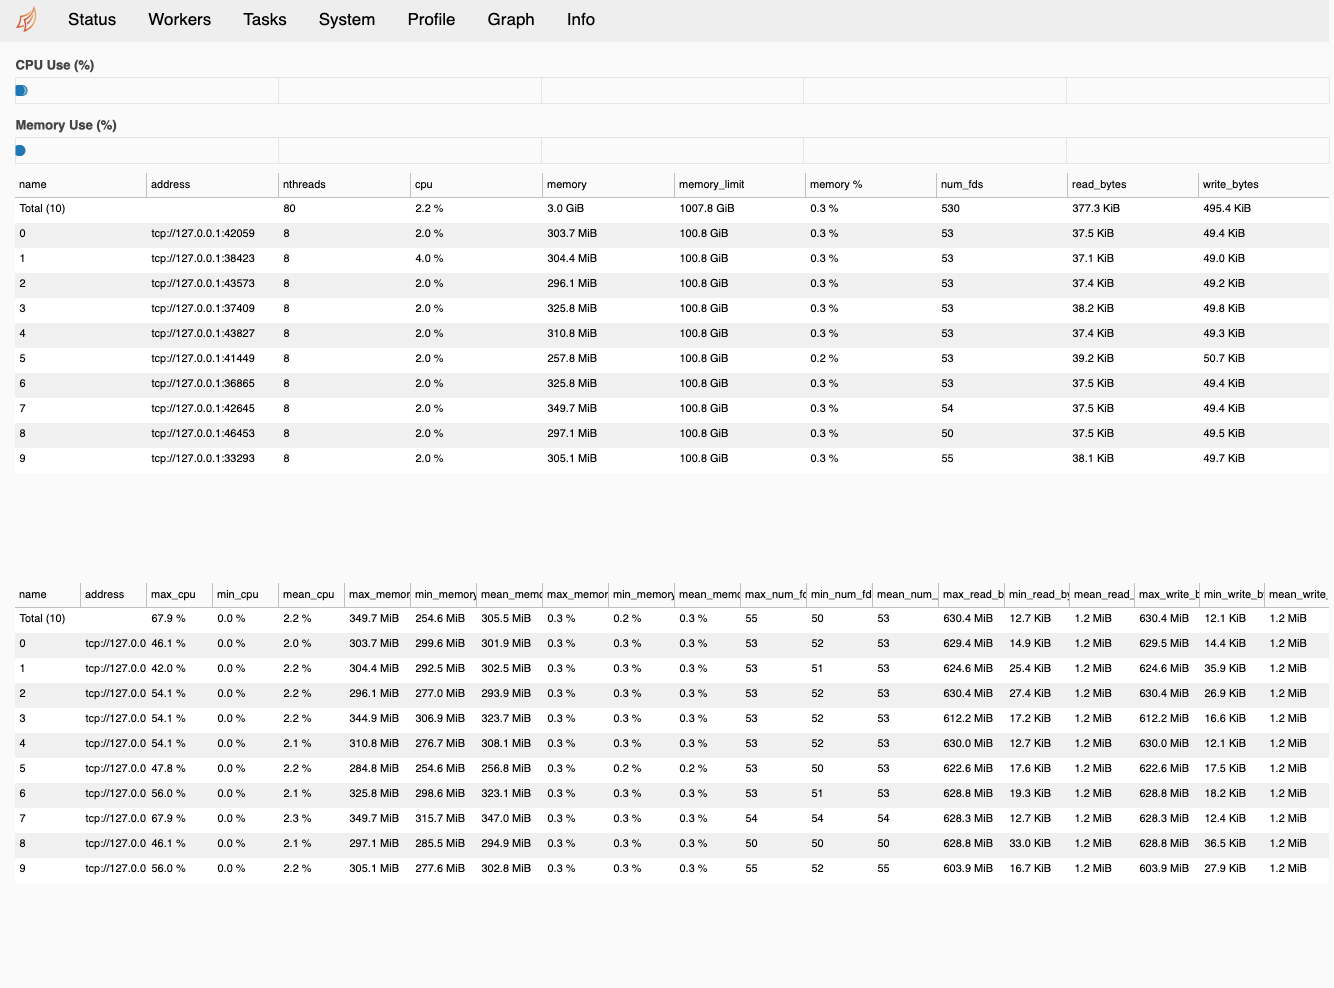
This PR adds a table of basic statistics (max, min, mean) for the worker metrics (CPU, memory, # of file descriptors, etc.) to the Workers tab of the dashboard:
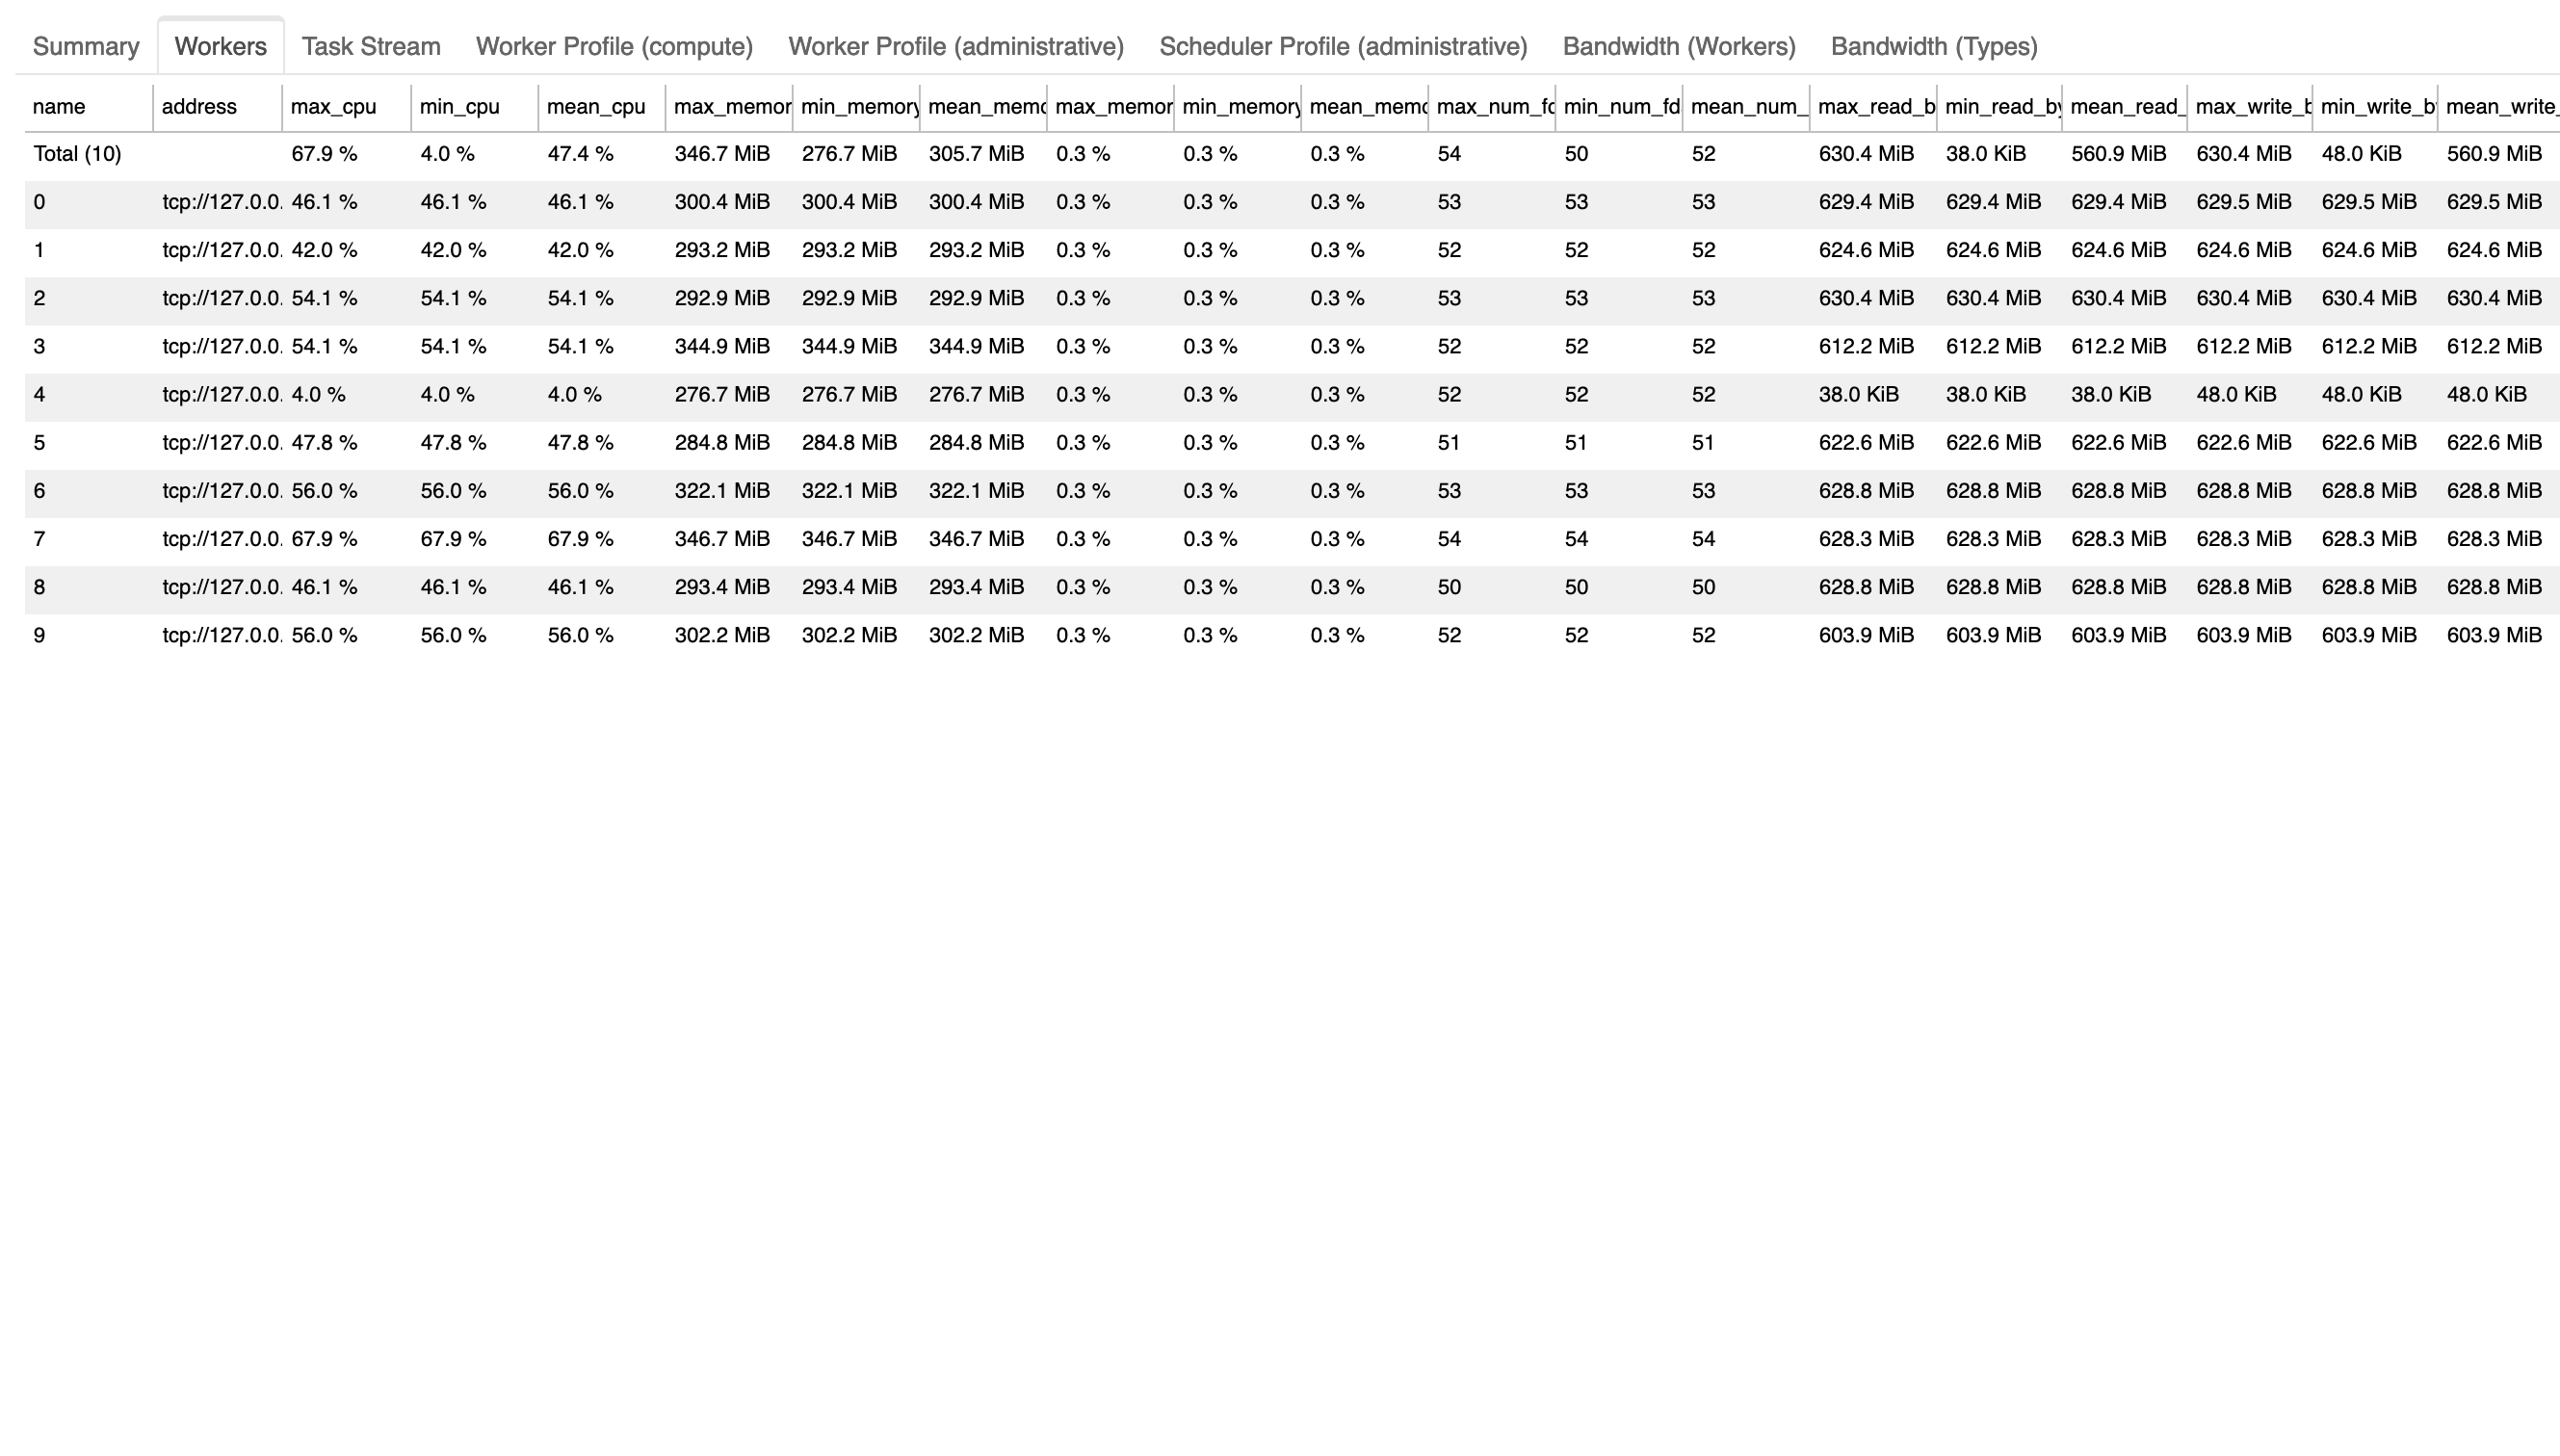
It also adds a Workers tab to the performance report containing this table, attempting to tackle some of the resource tracking desired in #4494:
Some questions:
-
This table is pretty crowded since I've included (to my knowledge) all dynamic metrics that could be aggregated; are there any metrics or statistics we don't really need to see in this table?
-
Are there any statistics we would like to see here, maybe for specific metrics?
-
[ ] Tests added / passed
-
[ ] Passes
black distributed/flake8 distributed
A few practical observations:
- I can't think of any reason why one would want to see the minimums. e.g. CPU is going to have a minimum of 0% by definition.
- "mean" is going to be wildly inaccurate if it's going to be from the moment the worker was started to now, as it's going to catch the time where the cluster was idle too. More meaningful measures could be:
- mean between the last time the cluster started processing tasks and the last time the cluster became idle again (or now, if it's still working)
- mean between the last X seconds (configurable)
- Those are a lot of columns which are going to confuse most users for the benefit of few. A solution (borrowed from many other modern GUIs that show tabular data) could be to make them opt-in through a drop-down menu?
Thanks for the comments!
I can't think of any reason why one would want to see the minimums.
I agree, in this context "min" doesn't seem to offer any insights; could it be useful if implemented as you've described "mean," where it's specifically targeting time periods when tasks are processing?
mean between the last time the cluster started processing tasks and the last time the cluster became idle again
This sounds like a great approach - is there a way we can check whether or not the cluster is currently idle? If not, could we add a nullable attribute like task_being_processed to the WorkerState.metrics to accomplish this? If so, this might also allow us to keep track of what tasks resulted in peak usage.
A solution (borrowed from many other modern GUIs that show tabular data) could be to make them opt-in through a drop-down menu?
Sounds good - I was also thinking of controlling this with arguments to the performance_report context manager, so the same thing could be accomplished there.
This sounds like a great approach - is there a way we can check whether or not the cluster is currently idle?
The scheduler keeps track of which works are currently underutilized
https://github.com/dask/distributed/blob/8942856bb83781c50c1307a3c8e8ed75f43191db/distributed/scheduler.py#L1569-L1570
and also keeps an idle_since attribute to monitor how long the cluster has been idle
https://github.com/dask/distributed/blob/8942856bb83781c50c1307a3c8e8ed75f43191db/distributed/scheduler.py#L3128
Thanks @jrbourbeau! Shouldn't be too difficult to conditionally update the mean if the worker isn't in scheduler.idle.
Bokeh's MultiChoice seems like a good option for the dropdown menu, but it overlaps with the data table:
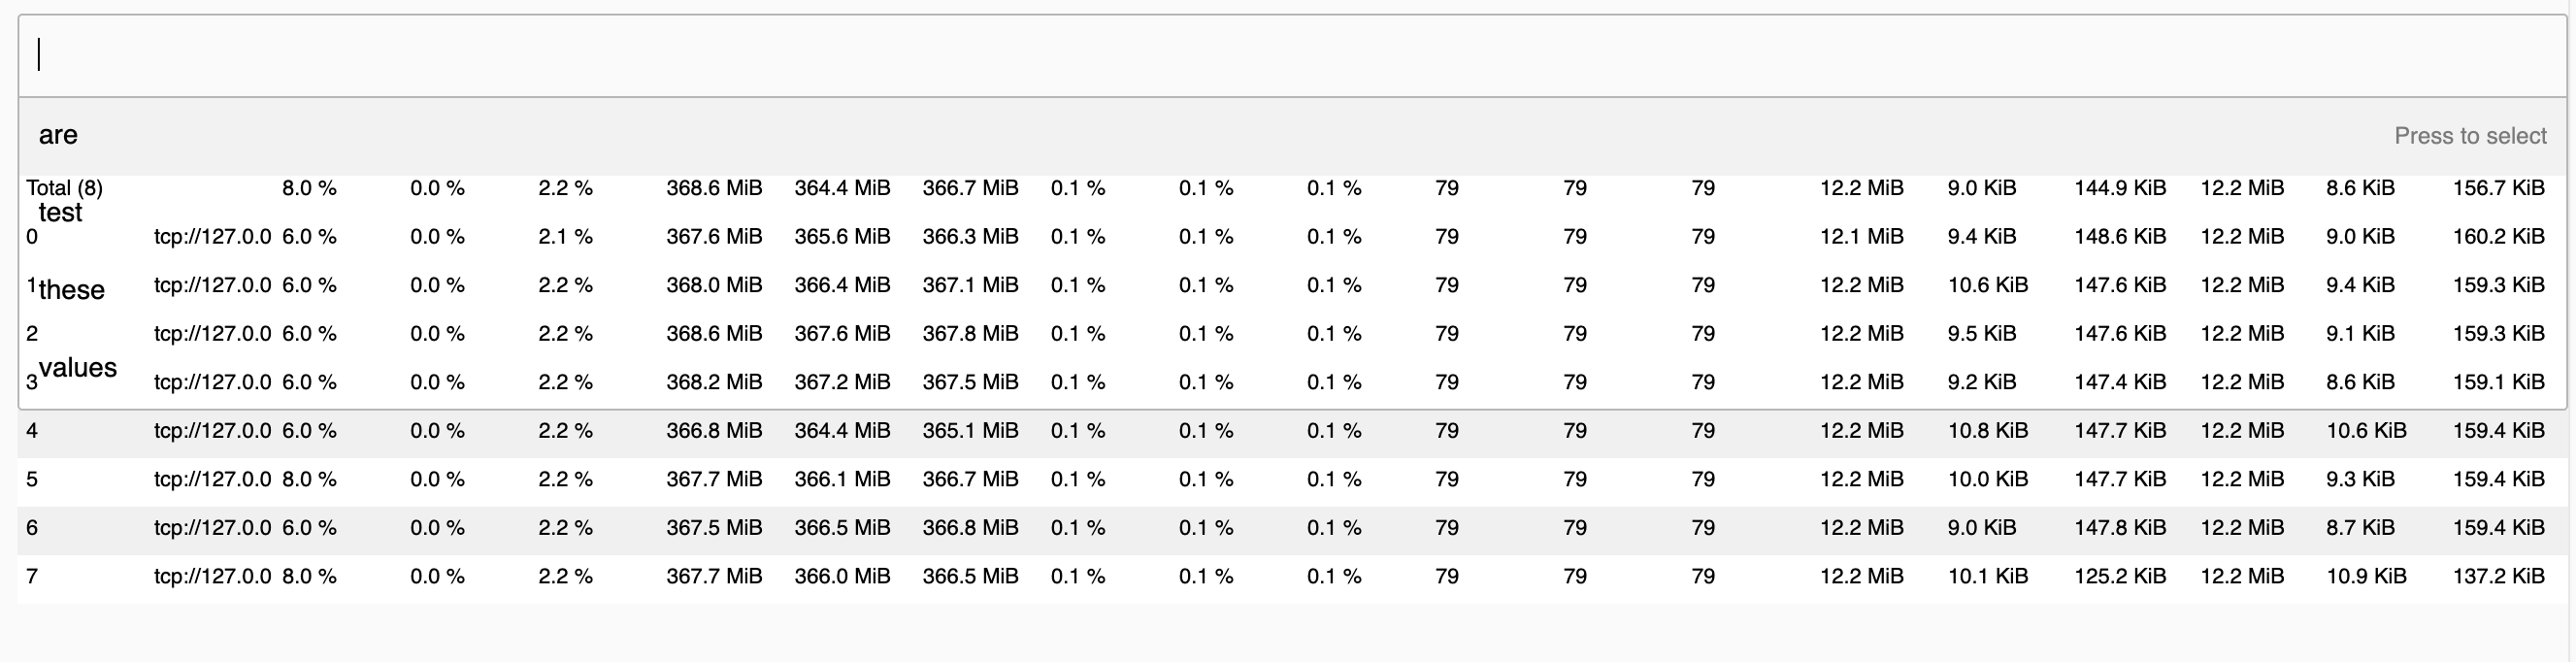
There might be a way to expand/collapse the dropdown's container using CSS, or we could orient the dropdown to be side-by-side with the table. An easier solution might be to use the CheckboxButtonGroup:
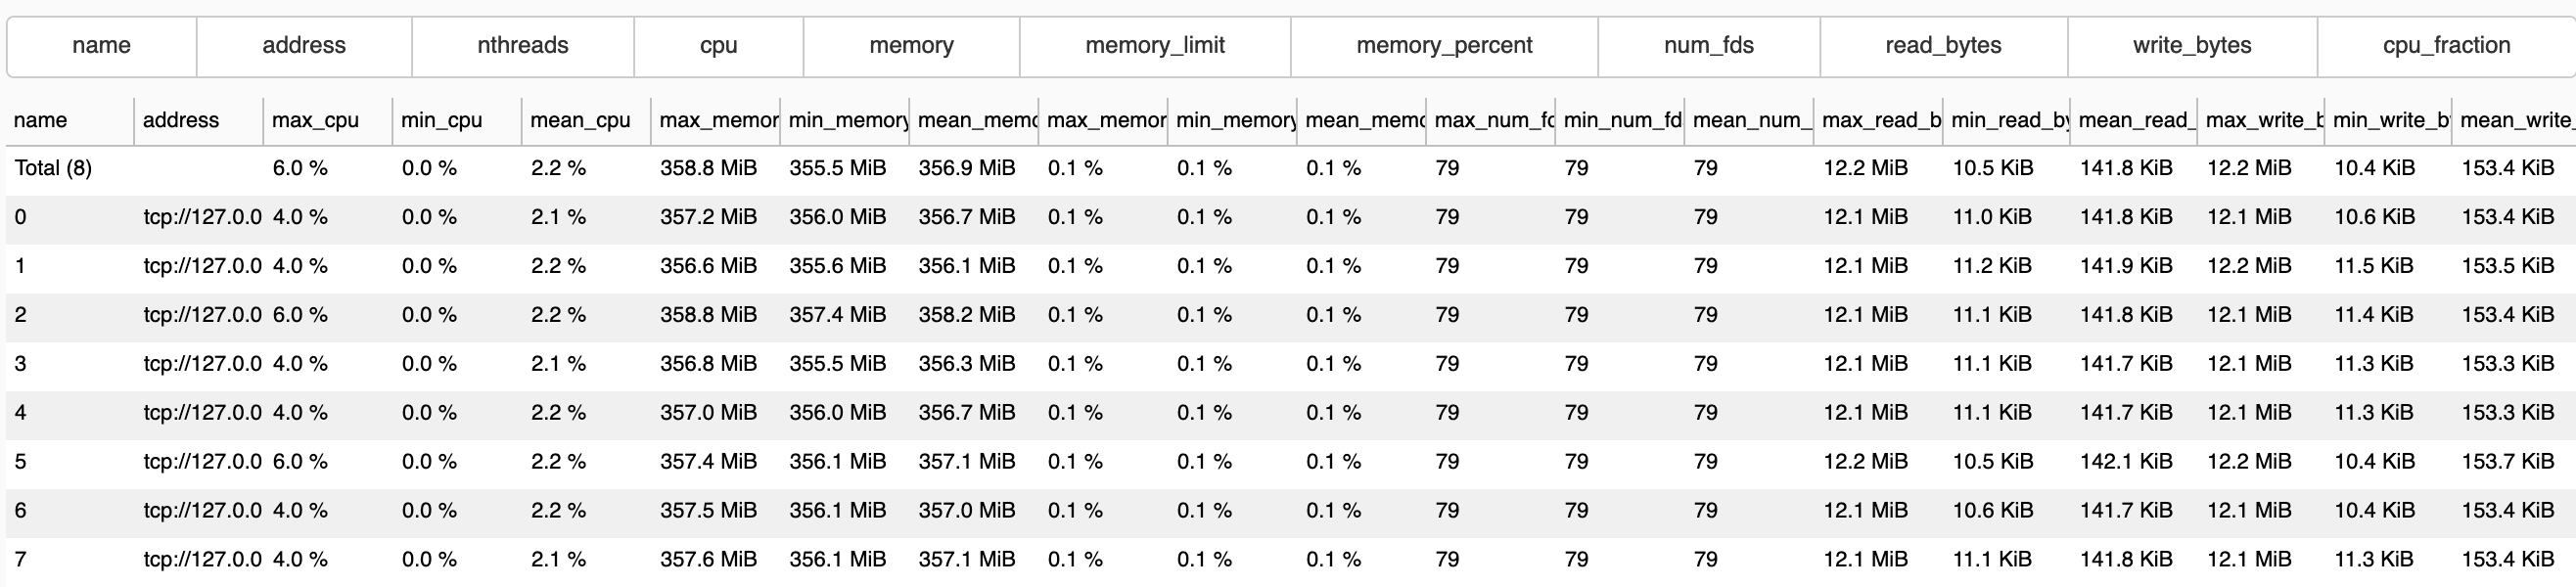
Added a basic checkbox widget to show/hide columns for the metrics table:
This could also be added for the original worker table pretty easily if needed.
Revisiting - do we still think something like this would be of use in the dashboard / perf reports? If I recall, I still need to figure out a reliable way to only track worker metrics when the workers are not idle.
I still need to figure out a reliable way to only track worker metrics when the workers are not idle.
This would probably be a quite significant change to what we're doing. While I 100% agree that the metrics would be more useful this way, I'm hesitant to introduce full timeseries metrics for performance and memory usage reasons. If all of that turns out to not be a big deal, all the better but I'm skeptical. We do have some crick based t-digest histograms which would be fine for this (instead of the mean we could use the median, ideally both imo). Imho, these are heavily underutilized but users obviously don't always have this installed.
Considering that we can toggle of unwanted columns to reduce clutter, I think we can merge this regardless and follow up with "better metrics" later on. Since I haven't been involved in this entire discussion, yet, I would appreciate a second opinion, though.
I'm hesitant to introduce full timeseries metrics for performance and memory usage reasons.
Do these metrics qualify as timeseries metrics? I tried to compute max and mean using only the the previous and next timestamps so that memory usage / performance hopefully wouldn't be impacted too heavily. I'm not sure how this might change if we were to only look at metrics when the workers are not idle.
Thanks for pointing out crick, I'll look into that.
I'm hesitant to introduce full timeseries metrics for performance and memory usage reasons.
Do these metrics qualify as timeseries metrics?
I honestly didn't realize we were already keeping these metrics in memory already, see https://github.com/dask/distributed/blob/d6f5609ac32d899e9ea30758e8033c3c614656eb/distributed/dashboard/components/scheduler.py#L2097
This creates a, albeit slowly, continuously increasing, unbound data sink and swallows a lot of memory over time. We typically use python deques for this task instead of plain lists to manage the memory footprint and prohibit this to grow without limit. That would possibly require the introduction of another config option, therefore I suggest to not intertwine this with this PR.
This would of course not be a problem if this data is pruned somewhere else but I'm not aware of such a mechansim.
I tried to compute max and mean using only the the previous and next
That's the typical algorithm to calculate these values for streaming data so this is perfectly fine. Crick is mostly useful to calculate metrics which are not that easy to calculate in streaming applications. For instance, how would you calculate the median in this situation without always looking at all vaules? This is where algorithms like TDigest come in (crick)>
I'm not sure how this might change if we were to only look at metrics when the workers are not idle.
Short answer is that we'll need to either implement a more complex, probably approximate algorithm or pay the price for always looking at all the data. This is more or less the problem I was mentioning with "I'm hesitant to introduce full timeseries data" since keeping all data and managing it efficiently can be complicated and/or costly and this problem might be just out of scope for this dashboard and better deferred to external application (e.g. prometheus) built for this kind of thing.
Sorry for the late follow up here - I'm interested in how that line would cause a continuously increasing sink here? From my understand of its role in the update() function, the lists there should all be N elements for the N workers currently active, which can potentially take up a lot of memory if we have a large number of workers, but in theory shouldn't take up more memory as time goes on. Is there something happening such that the data object here is being persisted over several calls to update()?
@charlesbluca sorry for the late follow up
Yes, I believe you are right and my concerns were unfounded. Sorry for holding this up for so long. Can you rebase, please?
Rebasing shouldn't be necessary. a Merge commit would be welcome as well (and may be easier)
On Tue, Jun 29, 2021 at 4:06 AM Florian Jetter @.***> wrote:
@charlesbluca https://github.com/charlesbluca sorry for the late follow up
Yes, I believe you are right and my concerns were unfounded. Sorry for holding this up for so long. Can you rebase, please?
— You are receiving this because you are subscribed to this thread. Reply to this email directly, view it on GitHub https://github.com/dask/distributed/pull/4614#issuecomment-870418444, or unsubscribe https://github.com/notifications/unsubscribe-auth/AACKZTAGFNHNKI3SHQB7QYLTVGEJZANCNFSM4ZPTTJHA .
I would hold off on committing, I noticed some Bokeh errrors from iPython console while revisiting this. Can post those in a second
EDIT:
Looks like deserialization errors occur when using the checkbox widget:
bokeh.server.protocol_handler - ERROR - error handling message
 message: Message 'PATCH-DOC' content: {'events': [{'kind': 'ModelChanged', 'model': {'id': '1601'}, 'attr': 'columns', 'new': [{'id': '1575'}, {'id': '1576'}, {'id': '1577'}, {'id': '1578'}, {'id': '1579'}, {'id': '1580'}, {'id': '1581'}, {'id': '1582'}]}], 'references': []}
 error: DeserializationError("Instance(TableColumn) failed to deserialize reference to {'id': '1575'}")
Traceback (most recent call last):
  File "/home/charlesbluca/miniconda3/envs/dask-distributed/lib/python3.8/site-packages/bokeh/server/protocol_handler.py", line 90, in handle
    work = await handler(message, connection)
  File "/home/charlesbluca/miniconda3/envs/dask-distributed/lib/python3.8/site-packages/bokeh/server/session.py", line 67, in _needs_document_lock_wrapper
    result = func(self, *args, **kwargs)
  File "/home/charlesbluca/miniconda3/envs/dask-distributed/lib/python3.8/site-packages/bokeh/server/session.py", line 261, in _handle_patch
    message.apply_to_document(self.document, self)
  File "/home/charlesbluca/miniconda3/envs/dask-distributed/lib/python3.8/site-packages/bokeh/protocol/messages/patch_doc.py", line 100, in apply_to_document
    doc._with_self_as_curdoc(lambda: doc.apply_json_patch(self.content, setter))
  File "/home/charlesbluca/miniconda3/envs/dask-distributed/lib/python3.8/site-packages/bokeh/document/document.py", line 1198, in _with_self_as_curdoc
    return f()
  File "/home/charlesbluca/miniconda3/envs/dask-distributed/lib/python3.8/site-packages/bokeh/protocol/messages/patch_doc.py", line 100, in <lambda>
    doc._with_self_as_curdoc(lambda: doc.apply_json_patch(self.content, setter))
  File "/home/charlesbluca/miniconda3/envs/dask-distributed/lib/python3.8/site-packages/bokeh/document/document.py", line 411, in apply_json_patch
    patched_obj.set_from_json(attr, value, models=references, setter=setter)
  File "/home/charlesbluca/miniconda3/envs/dask-distributed/lib/python3.8/site-packages/bokeh/core/has_props.py", line 412, in set_from_json
    descriptor.set_from_json(self, json, models, setter)
  File "/home/charlesbluca/miniconda3/envs/dask-distributed/lib/python3.8/site-packages/bokeh/core/property/descriptors.py", line 623, in set_from_json
    return super().set_from_json(obj, self.property.from_json(json, models), models, setter)
  File "/home/charlesbluca/miniconda3/envs/dask-distributed/lib/python3.8/site-packages/bokeh/core/property/container.py", line 70, in from_json
    return self._new_instance([ self.item_type.from_json(item, models) for item in json ])
  File "/home/charlesbluca/miniconda3/envs/dask-distributed/lib/python3.8/site-packages/bokeh/core/property/container.py", line 70, in <listcomp>
    return self._new_instance([ self.item_type.from_json(item, models) for item in json ])
  File "/home/charlesbluca/miniconda3/envs/dask-distributed/lib/python3.8/site-packages/bokeh/core/property/instance.py", line 93, in from_json
    raise DeserializationError(f"{self} failed to deserialize reference to {json}")
bokeh.core.property.bases.DeserializationError: Instance(TableColumn) failed to deserialize reference to {'id': '1575'}
Might need some additional Bokeh support to resolve this, but wondering if we can add a test that would catch something like this, since it went undetected by CI.
After posting about these issues on Bokeh's discourse, there are a couple solutions for the serialization errors:
- We can include a hidden table in the document that will hold the columns we toggle off, so that BokehJS doesn't lose reference to them
- If we set the minimum Bokeh version to 2.3, we can use a
DataModelto store this column data in place of the hidden table
With bokeh/bokeh#11501 merged, there's now a cleaner way to show/hide table columns by using their visible property. However, this would require us to bump our Bokeh min version to 2.4.
@quasiben @jacobtomlinson would there be objection to bumping Dask's bokeh dependency to 2.4.2? That's the first version to roll out a fix for the DeserializationErrors encountered above.
We could also try just 2.4.0 and make use of the visible property for columns, but for some reason the table seemed pretty sluggish on my machine when trying this out in https://github.com/dask/distributed/pull/4614/commits/c2c7064077ff7d128fee8da75a183c956aa69a93 (cc @bryevdv in case you have any suggestions here)
Unit Test Results
12 files ±0 12 suites ±0 7h 13m 30s :stopwatch: + 6m 47s 2 624 tests ±0 2 542 :heavy_check_mark: +1 80 :zzz: ±0 2 :x: - 1 15 668 runs ±0 14 804 :heavy_check_mark: - 3 862 :zzz: +4 2 :x: - 1
For more details on these failures, see this check.
Results for commit c5aff0bc. ± Comparison against base commit de94b408.
:recycle: This comment has been updated with latest results.
@charlesbluca visible for table columns was new in 2.4 and I have not heard any reports offhand of setting it being slow before this, but looking back at the PR, it does call invalidate_layout and there may be more efficient ways to go than that, especially if the table is part of a complicated layout. It would be helpful to make an issue, if you can form an MRE.
I can't think of any reason why we shouldn't bump the minimum version. We should ensure the conda-forge recipe is updated too though.
We should ensure the conda-forge recipe is updated too though.
Yeah we'll need to remember to follow up there - for now also updated the nightly recipe to reflect this change, and will open up a PR in Dask as I assume we'll also want dask.diagnostics bokeh pinning to match up?
It would be helpful to make an issue, if you can form an MRE.
Cool - I can look into putting together an MRE for this case.
My only comment re 2.4.2 is just to note that 2.4.2 is probably the last 2.x release that will be made. I am committed making sure it can demonstrated that Dask (in particular) is works solidly with 3.0 out of the box, but I could definitely use some help with that testing and evaluation once we start cutting 3.0 release candidates. (So far all my casual testing with Dask and branch-3.0 has gone fine FWIW)
@bryevdv I appreciate the effort in testing. If .2.4.2 is the last v2 and we are making it our floor perhaps we should bump the minimum to 3.0 immediately after the next release so that things can marinade on main for a bit. Thoughts @jsignell?
Unit Test Results
See test report for an extended history of previous test failures. This is useful for diagnosing flaky tests.
26 files + 1 26 suites +1 13h 43m 36s :stopwatch: - 43m 23s 3 545 tests ± 0 3 432 :heavy_check_mark: + 2 106 :zzz: ± 0 7 :x: - 2 44 845 runs +1 298 42 581 :heavy_check_mark: +1 264 2 236 :zzz: +35 28 :x: - 1
For more details on these failures, see this check.
Results for commit e867ded8. ± Comparison against base commit 4f0d1737.
:recycle: This comment has been updated with latest results.
Sorry to bump this after so long, @fjetter are you still generally okay with the idea of merging in these metrics and iterating on things moving forward?
@fjetter is on extended leave. @hayesgb could you figure out a replacement for review?
@fjetter seemed to withdraw his concerns in his last comment here
Yes, I believe you are right and my concerns were unfounded. Sorry for holding this up for so long.
@crusaderky if you agree with that sentiment I'm happy to take over this review.
@jacobtomlinson I haven't been involved at all. Very happy for you to take over review
Bumping this since it's been a while - is this still something we think would be useful within the dashboard / performance reports? If so, I've gone ahead and resolved upstream conflicts so we can check if this is breaking anything new in CI