matplotlibrc
 matplotlibrc copied to clipboard
Repository for Matplotlib Styles (matplotlibrc)
Making Matplotlib Less Uggly, Quickly
This repository contains matplotlib style configurations (matplotlibrc's) that I have accumulated. Disclaimer: I might have poor taste. However, I feel that disseminating matplotlibrc files allows everyone to use them while preventing people from having to buy into some plotting package that has good taste. The styles are heavily borrowed from the seaborn python package. The gist style was borrowed from here.
Note: The matplotlibrc files have latex enabled by default (text.usetex: True). You can disable this setting by commenting out this option.
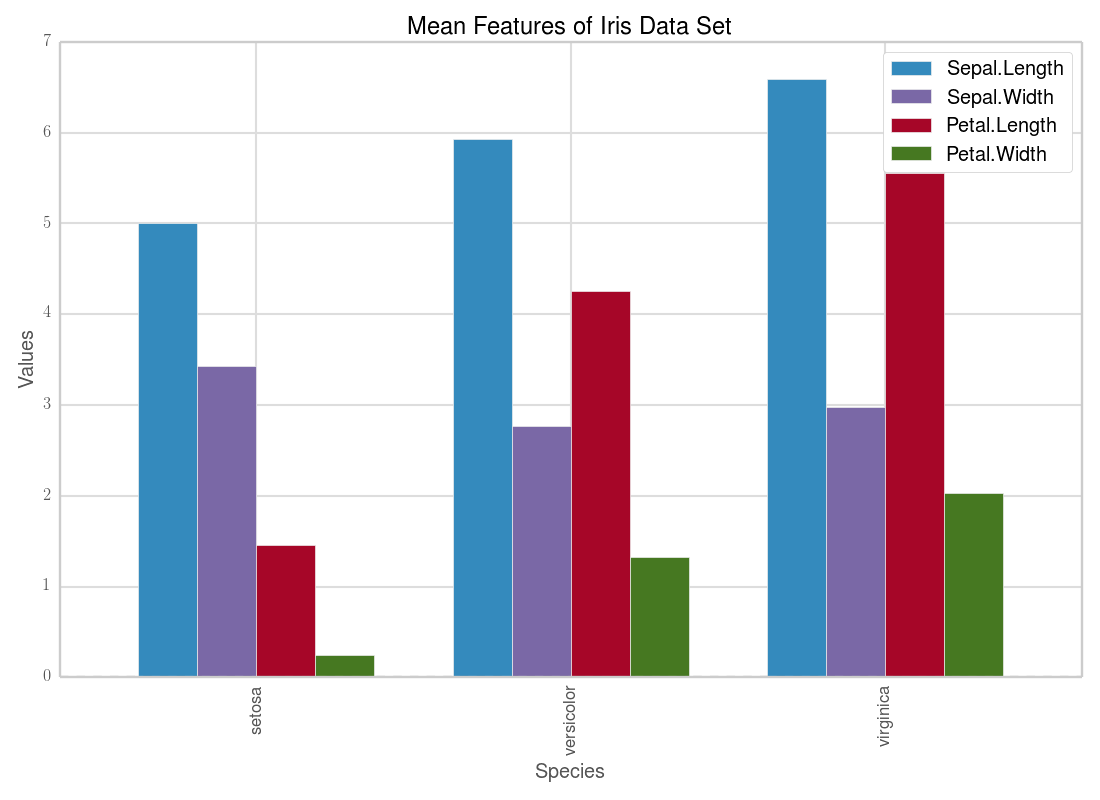
Gallery
The gallery is of bar plots, but they really could have any type of plot, e.g. line, histograms, etc.
Obligatory ggplot2 clone . . .


But can ggplot2 do this?

whitegrid

gist


darkgrid


nogrid


Making a Style your Default
You first need to figure out where your default matplotlibrc is located.
You can find the path by entering the following in the python interactive shell:
>>> import matplotlib as mpl
>>> mpl.matplotlib_fname()
Then simply replace the default with your style of choice. Say if you like the ggplot2 like style then your command will look something like this:
cp ggpot2/ggplot2_paper /your/default/path/matplotlibrc
You can also copy a style to your pwd and name it matplotlibrc. Matplotlib
will then by default first use the matplotlibrc file in your present working
directory.
Switching Styles Mid-Code
Matplotlib now has a context handler. You can switch between styles by just using with
statements pointing toward your matplotlibrc file.
import matplotlib as mpl

with mpl.rc_context(rc={}, fname='ggplot2/ggplot2_paper'):
    # ... do some plotting here
    # any code in this block will first follow the above
    # rc dictionary and then the ggplot2 like style
    pass
Font Sizes
I have different matplotlibrc files for different intended purposes. Enormous font sizes that are great for presentations don't necessarily look so great on your monitor. I have stratified each style with different font sizes.
Paper font size
- base font size = 12.0
- title size = x-large
- axes label size = large
- xtick/ytick labels = medium
- legend font size = large
Talk font size
- base font size = 14.0
- title size = x-large
- axes label size = large
- xtick/ytick labels = medium
- legend font size = medium
Poster font size
- base font size = 16.0
- title size = xx-large
- axes label size = x-large
- xtick/ytick labels = large
- legend font size = medium
Fork me?
I don't claim I have a good sense of style for plotting. Perhaps you could contribute new styles or update the existing ones.
License
It's Apache 2.0.