Reduce cardinality
The number of processes reporting detail typically exceeds the ability for TSDB and other technologies to support in any reasonable manner. We need to consider mechanisms to aggregate at some level before sending to certain endpoints.
In the near term we would like to determine what's possible using LogStream. Once we establish a level if repeatability we will look at mechanisms to generalize.
I'm exploring this in a docker-compose test environment with a couple cribl/scope containers running scope watch, a cribl/cribl container for LogStream, and an influxdb container. The scope containers are sending events and metrics to logstream. The cribl container routes everything to influx. I can see the resulting measurements in the stock InfluxDB web UI.
For reference, AppScope is generating metrics that look like this.
{"type":"metric","body":{"_metric":"proc.cpu_perc","_metric_type":"gauge","_value":0.0489,"proc":"sh","pid":3072,"host":"scope-df","unit":"percent","_time":1631046171.757}}
and Influx gets something like this from LogStream. (note this isn't from the exact message above)
proc,proc=df,pid=231,host=scope-df,unit=percent cpu_perc=0.0664 1631043331727
The proc.cpu_perc metric became a proc measurement with a cpu_perc field with the given value and the other fields became "tags". Those tags in InfluxDB become index dimensions and when their cardinality (the number of distinct values in each dimension) gets high, insert and query performance suffers.
Looking at the tags being generated from scoping things like df and mtr periodically via scope watch I'm seeing fs, net, and proc measurements with tags like host, proc, args, pid, op, and unit. Of these, only pid appears unbounded in this setup. If we were scoping everything on an interactive host then we could see higher cardinality from proc and args. If we were scoping processes in ephemeral VMs or containers then we could see it in host as well. We'll see others if we scoped other processes and got the full suite of metrics that AppScope produces.
InfluxDB's docs have a best practice page discussing issues with high-cardinality. There is a query there that counts the number distinct values for each tag and as expected, we see ~20k different pid values and the rest are all under a dozen.
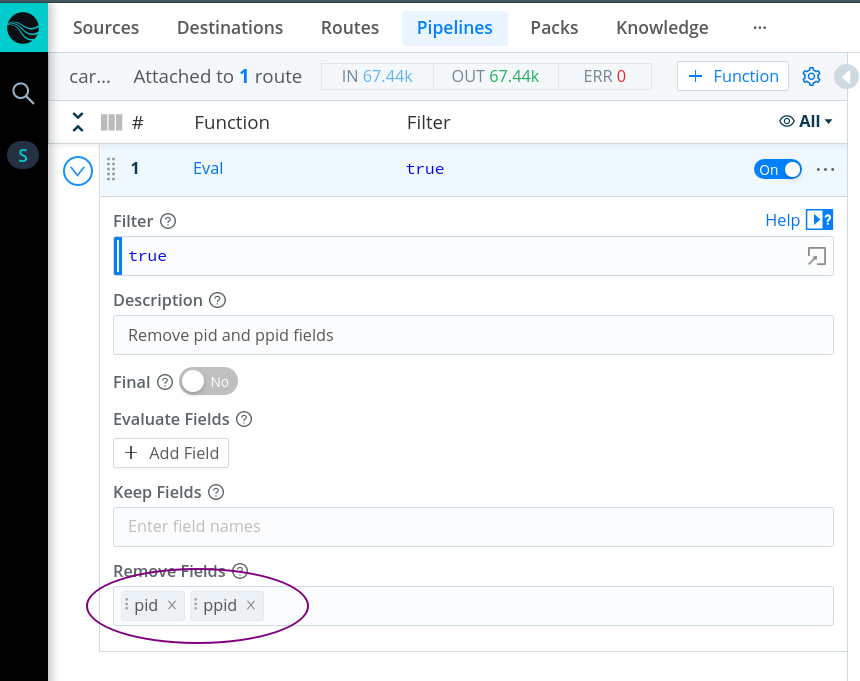
As expected, using pid as a metric dimension is a problem when storing metrics in a TSDB like InfluxDB. The solution seems to be to exclude troublesome tags by filtering them out in LogStream in the short run.
In the long run, we could consider ways to configure to AppScope to exclude them at the source.
Here is the pack I'm using. Your analysis is correct but you can't just remove the PID, because now you have a bunch of time series which are actually from distinct PIDs but they all look the same. Your results in the TSDB will be very wonky, because essentially you'll have entries from the same time ranges from many different processes without being able to distinguish them.
This pack that I'm attaching aggregates across processes, which is what we will need to do to solve the problem. Counters and gauges can be summed (usually), and timers are lossy so they need a number of aggregations done across all the samples. appscope.crbl.gz