nova-chartjs

nova-chartjs copied to clipboard
How to add button filter on line chart?
I want to add a button filter on a line chart. but I don't know why it's not showing there.
(new LineChart())
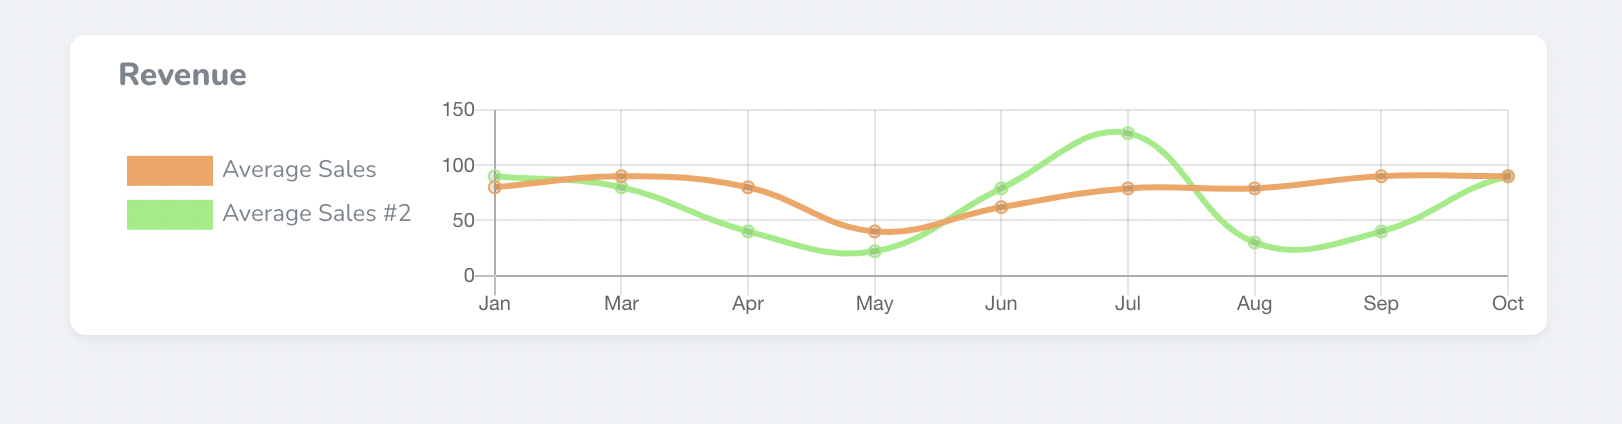
->title('Revenue')
->animations([
'enabled' => true,
'easing' => 'easeinout',
])
->series([[
'label' => 'Average Sales',
'borderColor' => '#f7a35c',
'fill' => true,
'data' => [80, 90, 80, 40, 62, 79, 79, 90, 90, 90, 92, 91],
], [
'fill' => true,
'label' => 'Average Sales #2',
'borderColor' => '#90ed7d',
'data' => [90, 80, 40, 22, 79, 129, 30, 40, 90, 92, 91, 80],
]])
->options([
'xaxis' => [
'categories' => ['Jan', 'Mar', 'Apr', 'May', 'Jun', 'Jul', 'Aug', 'Sep', 'Oct']
],
'btnFilter' => true,
])
->width('2/3'),
can you plz support me here? how can I add filter button?