MacOS Simulator: display.save always produces blank image on first call
- [x ] I tried searching Solar2D forums for the solution.
Describe the bug In the MacOS simulator 3674 I have to introduce a junk display.save call as the first time I invoke it, it always produces a blank file.
To Reproduce Steps to reproduce the behaviour:
- run this code - requires a dot.png I am using a 200x200 white circle on a transparent background
function safeSave()
	local temp=display.newImage("dot.png")
	display.save(temp,{filename="junk.png",isFullResolution=true})
	display.save(temp,{filename="top_dot.png",isFullResolution=true})
	display.save(temp,{filename="bottom_dot.png",isFullResolution=true})

end
timer.performWithDelay(100,safeSave)
- check the documents folder in the apps sandbox junk.png is blank
Target platform and where build was made:
- Device: MacOS Simulaot 2022.3674
- OS: MacOS 12.4
Hi @personalnadir. I mentioned this on the forum since this issue was part of what the OP described.
Same question: are you able to build the engine from source, by any chance? I either can't reproduce this on my own machine or don't know how, but maybe I could point to some things to try.
@ggcrunchy can do, how do I go about doing that? I tried running the template iphone project, but it can't find Lua. Wasn't sure if I need to run iphone or macOS project
Hi @personalnadir.
So, assuming you have Git installed, do git clone --recursive https://github.com/coronalabs/corona.git into some folder.
From there, go to platform/mac and follow the instructions at the bottom of this page (The lua, luac, rttplayer player order is necessary, in my experience.)
There's also some account stuff to set up, in General or Build Settings I think. I just use the Development account and ID and it's fine for testing.
If you get that far I can point you at some likely trouble spots. The capture itself happens here but there might be stuff before and after that, as well as a spot or two elsewhere in the code, that need checking. Also, I'm in the Solar2D Discord as Star Crunch, so feel free to DM me and / or chime in there.
@ggcrunchy I have the simulator running and the example above is actually slightly worse (more image corruption on the 2nd and 3rd save calls) than the release simulator. Any changes you'd like me to try?
Also it's not possible to build the simulator if any part of the absolute project path contains a space. I had cloned the repository to my Open Source folder and that broke the build (it was a lua related stage).
Here are the files it produces in order:
junk.png

top_dot.png

bottom_dot.png

Oh, heh, didn't know about the space thing, although I've run into the issue with plugins and their build.sh scripts.
There are a few broad things I can think of to check off hand.
1
On Mac the renderer has this very conspicuous bit.
That function is also called at initialization time (on all platforms) here.
So... you can put a breakpoint in that InitializeFBO call here and see what the value of fDefaultFBO is. On my machine it's 0, but I don't know if that's universal or not, given that earlier condition at the beginning of Execute(). (Note that you'll also get the welcome screen this way, so you'll want to check that but then step again.)
IF that can be non-0, then some slightly buggy behavior in Capture() needs fixing. You'll see at the end of that function how it restores the frame buffer, viewport, etc. However, those only submit commands, to be processed in Execute()... whereas that InitializeFBO() will happily grab the current FBO, which is still whatever was used to do the capture.
If fDefaultFBO was 0, the Rtt_DELETE( fbo ) will clean everything up and per the OpenGL docs assign the proper default framebuffer, since if it was bound that gets restored to 0. Otherwise, we're in trouble.
2
If the first one looks okay, I'd try looking at the bitmap following the first capture to see if it's just all 0 values.
You might need to use the second capture as a reference, since the first values might be a ways in.
3
It almost seems like the texture isn't fully uploaded before being used.
You might try going back to Execute() and putting glFlush(); and / or glFinish() at the end. (Try all three combinations, I guess.)
If it still looks bad, try again with those at the beginning of Execute() instead. (This might make more sense, actually, but for completeness don't try it first.)
(The Render() call here will in turn call Execute(), but the Swap() will create and / or update GPU-side resources.)
Anyhow, give those a shot. :smile:
I had a quick look
- fDefaultFBO was always 0 on my machine
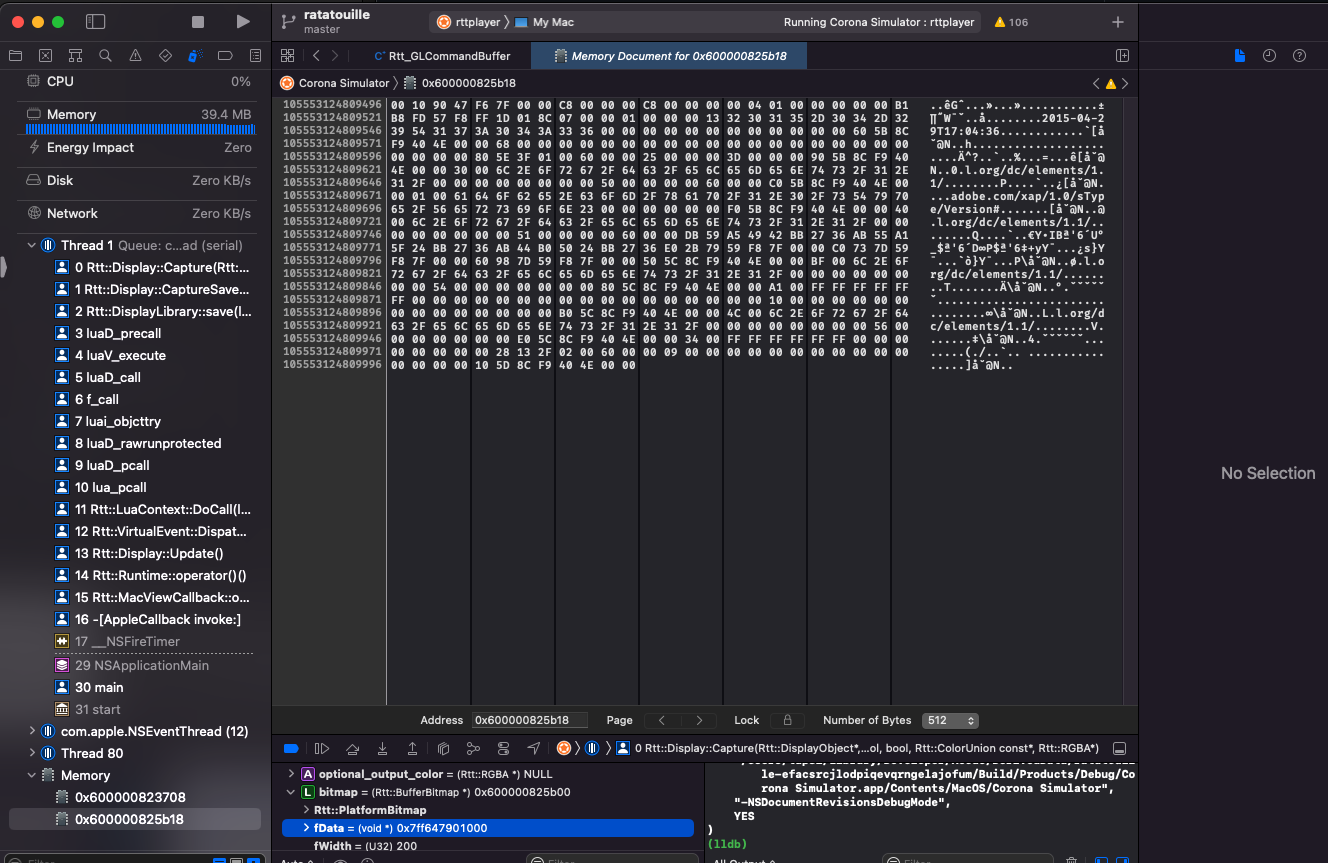
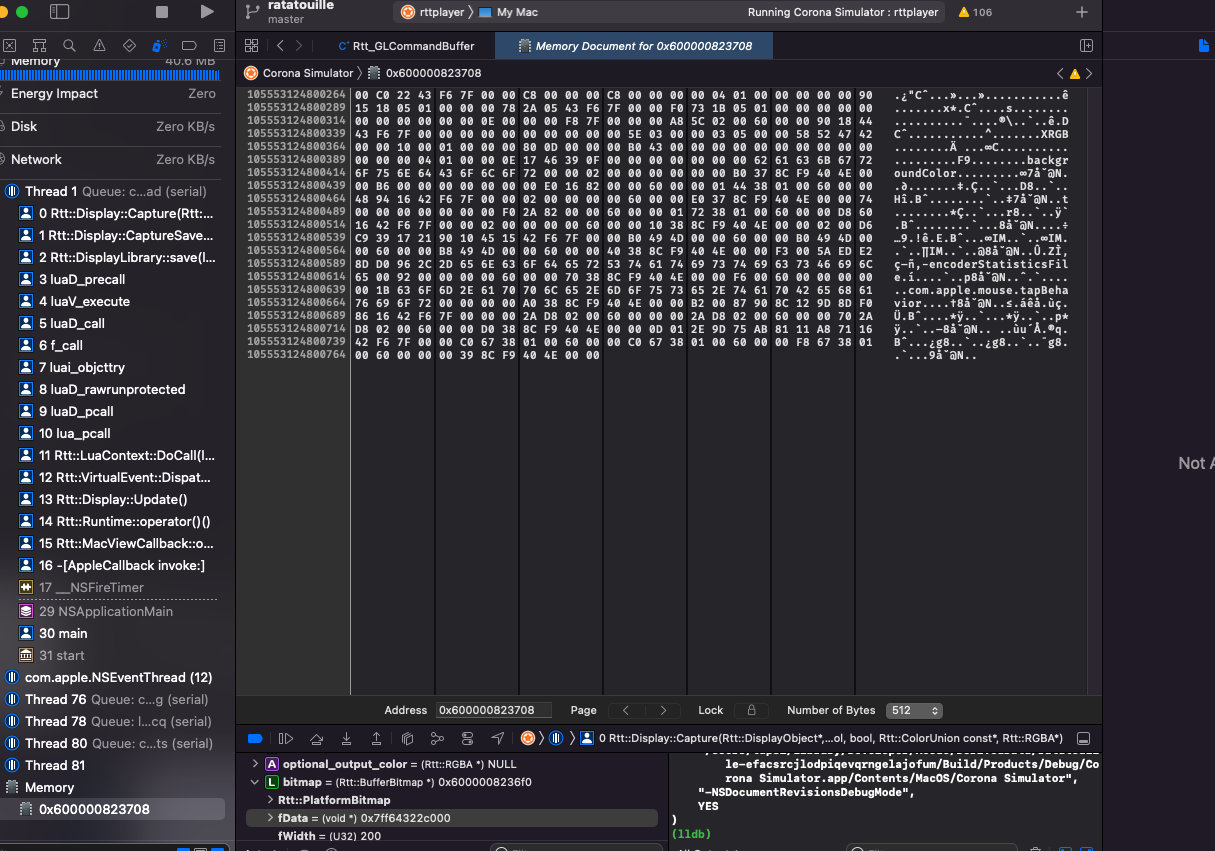
- I assume this is done by Viewing the the memory of fData? In that case the values were not zero, but were only identical on the 2nd and 3rd calls. Will have a look at 3 tomorrow
Actually I tried 3 and neither the glFlush() and / or glFinish() at the beginning or end of Execute seemed to make any difference.
Back to 2 for a second, then. Does the fData look any different before and after the capture, i.e. the fStream->CaptureFrameBuffer() call? I mean, it seems like if it were garbage you should have a pretty garish image. 😃 If you look at junk.png in a hex editor, does it look reasonable? (Might be hard to compare due to the header and compression, of course.)
(It would be strange, but not impossible, that it's the saving logic that has a flaw. No ideas here from me.)
Something you could try in CaptureFrameBuffer() itself: add a GL_CHECK_ERROR(); before and after it, and a `#include "Renderer/Rtt_GL.h" before the function itself. Maybe that complains on the first call?
I don't have any immediate ideas beyond these, but I'll think about it some more and maybe dig around.
Junk.png looks like a valid png (to my untrained eye) when I view the hex, but once it gets into the image data it's just the same hex pattern repeating endlessly.
Viewing memory of fData I noticed some odd strings in it. Not sure how relevant it is
Adding the #include "Renderer/Rtt_GL.h" line breaks all the Rtt namespace calls in the file, so haven't been able to test the GL_CHECK_ERROR calls. Anyway round that?
Ah, you're actually seeing the variable fData (you can see the first six bytes there are 0x7FF64322C000, only reversed), followed by the rest of bitmap` and whatever comes after it in memory. The memory you actually want to look at is that number, though, which points to the data.
On Windows I do see some errors, yeah. That GL call is kind of where it shouldn't be, out in more backend-agnostic code.
On my Vulkan backend I shuffled some of this around, since it had to accommodate both GL and Vulkan backends.
You could try the changes from the first three files here. (Never mind the BeginFrame() and insertion limit stuff.) Include "Renderer/Rtt_GL.h" where "Rtt_GPUStream.h" is included.
Actually, below that last line is ENABLE_DEBUG_PRINT. If the post-capture memory looks off, you could try setting that to 1 in GLFrameBufferObject and GLTexture, just to see if they give you values of 0 for some reason.
(More relevant to your other issue, perhaps, you could also turn it on in GLCommandBuffer, though this is quite noisy.)
Ah that makes sense. How do I see the actual value of fData? If I select 'View Memory of "*fData"' the data remains largely full of zeros in all cases.
Well, if it's a circle like that I'd jump down fWidth * 4 * X bytes (4 = RGBA, X = some guess for number of rows) from the value in fData. The lots of zero values makes sense just because of the empty space. Even though the second / third image is messed up, the idea is to see if the first one has anything at all. (If not, we can at least rule out a problem in the saving logic.)
Oh, also, those debug prints would show up in the Solar2D console, though they might get mirrored to Xcode output too, not sure.
Are there any changes if you switch skins and / or zoom levels?
This appears to be fixed with the newer versions of Corona/Solar2D Sim