d3-annotate
 d3-annotate copied to clipboard
📌 Interactively and programmatically add, edit, move and save SVG chart annotations.
d3-annotate
Interactively add, edit, move and save SVG chart annotations.
Install
If you use NPM, npm install d3-annotate. Otherwise, download the latest release.
Interactions
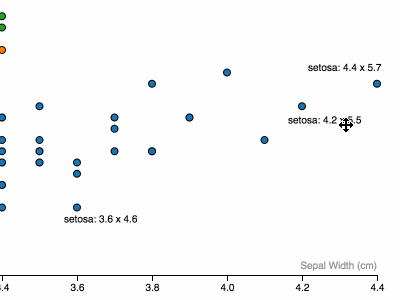
Drag to move
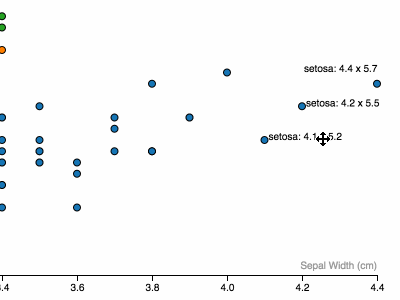
Click an element from selection to add annotation
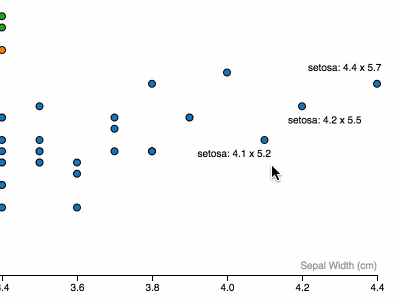
Command + Click to remove an annotation
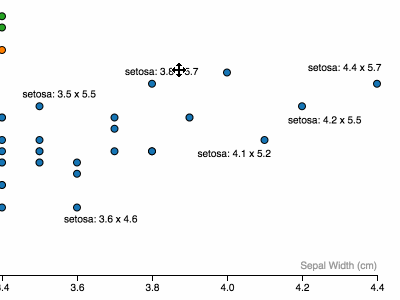
Shift + Click to edit annotation copy then [Enter] or unfocus text input to save
API
####d3.annotate()
Initialize a new annotation behavior.
.container([d3 <g> or <svg> selection]) (required)
Sets container to render annotations to. _Note: should have translate to match data.
.key([fn]) (d) => d.id by default
Sets key to be used for serializing annotations and joining annotations with data
.text([fn]) indentity by default
Sets the default text for an annotation. eg: .text((d) => `${d.name}: ${d.score}`)
.attr([attrName(eg: x, y, text-anchor, fill)], [value or fn]) (similar to d3.select(...).attr)
.attr will get called on <text> elements created from annotation. However, instead of only having access to the bound data(d.data) - you have access to what is returned from .getBBox() of the target element (d.box), eg:
// Place labels to the left of target element (centered vertically and horizontally by default)
.attr('x', (d) => d.box.x)
.attr('text-anchor', 'end')

// Color labels based on data in target element
.attr('fill', (d) => palette(d.data.category))
.show([boolean or function])
Create annotations automatically(true will create an annotation for every datum)
.saved([annotation object])
Add object of annotations to be rendered on .call(annotation), created from calling annotation.serialize()
.serialize()
Returns an object of annotations based on current state of annotations.
Example Usage
// render some chart elements with data
var bubbles = chartArea.selectAll('.bubble').data(cars) ....

var annotation = d3.annotate()
      .continer(chartArea.append('g'))
      .key((d) => d.model + d.year)
      .text((d) => `${d.make} ${d.model}: ${d.mpg} miles per gallon`)
      .show((d) => d.year === 2016) // create annotations only for 2016 models, initially
      .saved({'prius2015':{text:'Most efficient',x:400,y:600}})
      .attr('fill', (d) => makeColors(d.data.make));

d3.selectAll('.bubble').call(annotation); // <text> elements get created
[User interaction to move, edit, rewrite annotations]
JSON.stringify(annotation.serialize()) // can be saved for creating inital annotation state
CSS
To style annotations, use a selector a la:
#myChart .d3-an-container .annotation
For a better experience, add the following CSS to your page or CSS build system:
.d3-an-container .annotation { cursor: move; }
.d3-an-container .annotation.dragging {
  cursor: grabbing;
  cursor: -moz-grabbing;
  cursor: -webkit-grabbing;
  text-decoration: underline; }
.d3-an-text-edit {
  position: fixed;
  top: 40px;
  left: 40px; }
Author
By @ChrisPolis
License
This project is licensed under the terms of the MIT license.