Consider live value for alert MySQLGaleraRecvQueueLengthTooHigh
I have issues with the MySQLGaleraRecvQueueLengthTooHigh alert which is triggering for a very long time: hours after an incident on the galera cluster has been resolved (eg. recreating one of the node vm)
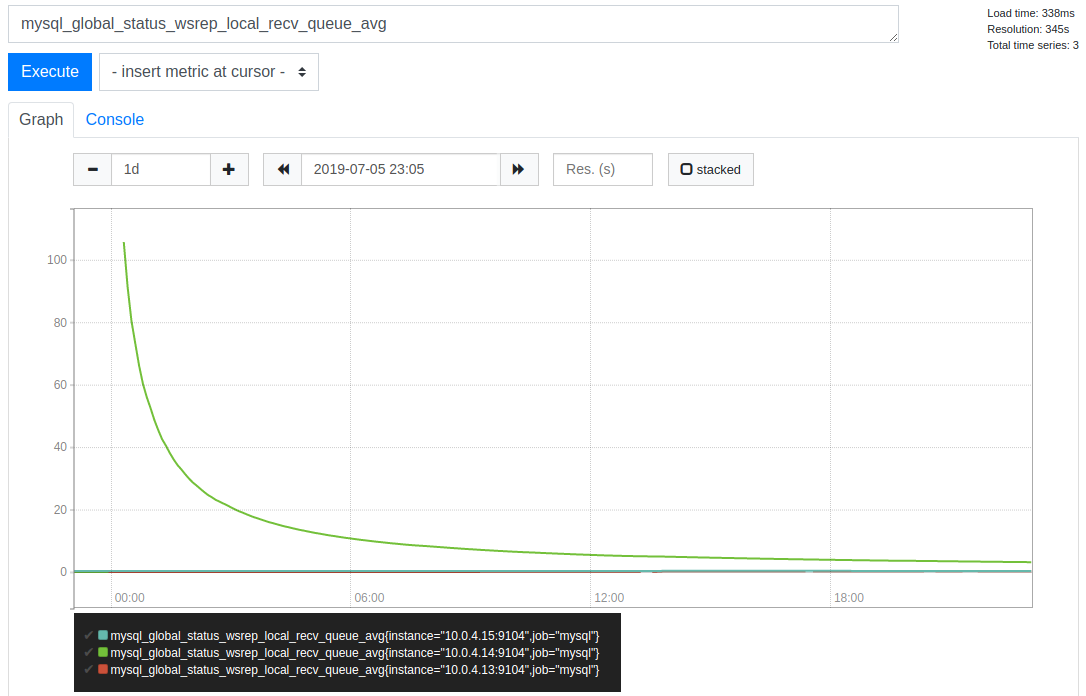
From my understanding, the alert is based on the mysql_global_status_wsrep_local_recv_queue_avg metrics which is itself read from the wsrep_local_recv_queue_avg status on the galera cluster.
Live values can be read on the cluster using the query
SHOW GLOBAL STATUS LIKE 'wsrep_%';
The definition for the wsrep_local_recv_queue_avg status states:
Recv queue length averaged over interval since the last FLUSH STATUS command.
After recreation, my node starts with a quite high recv_queue, then quickly falls to 0 within minutes.
However, since this metric is averaged over time, it take hours to fall back under the configured threshold.
Shouldn't we consider using the live metric mysql_global_status_wsrep_local_recv_queue based on wsrep_local_recv_queue_avg and configure an alert that use prometheus average functions ?
Something like avg_over_time(mysql_global_status_wsrep_local_recv_queue[5m]) ?
LMK your opinion on this. I can create a PR if that helps.