Bar chart has border artifacts
Expected Behavior
Bar chart with borderWidth = 0 has no border. The bar itself should be a solid block of the chosen color. Bar chart with borderWidth > 0 should have a border in the chosen color, but no other lines/colors.
Current Behavior
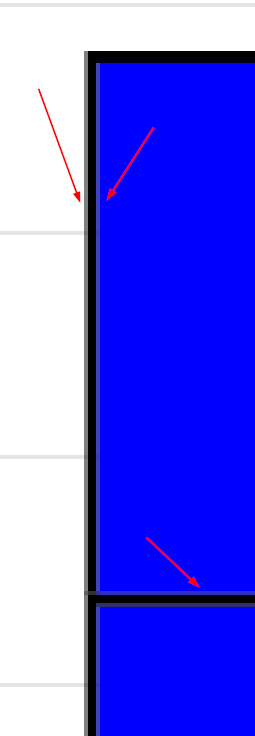
Bar chart has some kind of border, when borderWidth = 0:
 https://codepen.io/nwi4/pen/KKvOdbW
Bar chart has some other lines around the border, with borderWidth > 0:
 https://codepen.io/nwi4/pen/mdMNBJw
Are there some settings I am missing to tweak this behavior?
Context
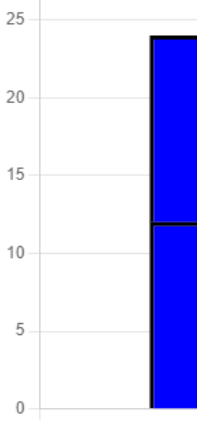
When stacking multiple (small) bars on each other, the unwanted lines blur the edges and it looks more like a gradient than multiple distinct bars:
 There are 2 big bars, and 3 very small bars, which looks like the fade out of the bigger one before.
Environment
- Chart.js version: 3.6.0
- Browser name and version: Chrome 96
We also have this issue, and a related issue where if we have a borderWidth of 1 or 2 with an identical borderColor and backgroundColor, it becomes more pronounced, as though there's a 'ghost border'.

If we add a much bigger borderWidth, it shows as a fine white line between the 'border' and 'backgroundColor'.

Thank you for your answer.
I updated the examples and this option helps a little, some unwanted lines are now gone, but some remain:

Its called anti-aliasing and afaik can not be turned off (except for maybe some browsers).
https://stackoverflow.com/questions/195262/can-i-turn-off-antialiasing-on-an-html-canvas-element
Oh, another thing you can do, set devicePixelRatio higher than your display has.
1
2

4

Hi! Can I solve this issue as a good-first-issue? Is it hard or easy? Can anyone help me to solve it?

Seeing the same error as above with line charts

"chart.js": "^4.3.0",
    "chartjs-adapter-luxon": "^1.3.1",
    "chartjs-plugin-annotation": "^2.2.1",