Tick rotation/autoSkip calculations assume full space is used
Expected Behavior
Tick/Label size and space calculations should take into account where the labels start/stop, and use that information to calculate a more approximate measure of label space.
Current Behavior
Tick calculations assume they start and stop at the full size of the axis, which is not always the case.
This is most obvious in small usecases - both small sizes and small number of labels - as these are the cases where the disparity between "real" and calculated tick space, sizes and distances is greatest. A good example is time scales using "week" as the unit, where the days may not match the points where the weeks start exactly, so a relatively large empty (tickless) space can exist st the edges of the chart.
Possible Solution
The scale's getPixelForValue will likely need to be used in the calculateLabelRotation/autoSkip functions, but I didn't do enough research yet to determine all possible implications of this.
Steps to Reproduce
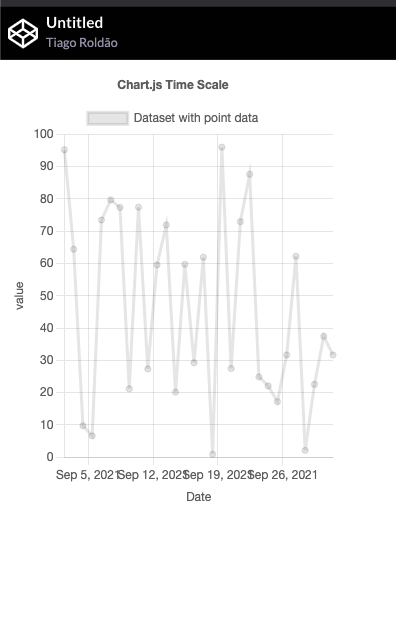
Live example: https://codepen.io/tiagoroldao/pen/mdwEMoG
Context
This was detected while using chartJS to create small widgets on a dashboard. These are often small charts with time data (i.e. "last 30 days") where this is a common
Environment
- Chart.js version: 3.5.1
In the codepen example, I noticed if to change the max-width for .myChartDiv to the same width as on the canvas it will be represented correctly, i.e.:
.myChartDiv {
  max-width: 300px;
  max-height: 400px;
}
In the codepen example, I noticed if to change the max-width for .myChartDiv to the same width as on the canvas it will be represented correctly, i.e.:
.myChartDiv {
  max-width: 300px;
  max-height: 400px;
}
This is purely by coincidence. Due to the way width is calculated for auto-rotation calculations, only certain chart width/tick size combinations trigger this, and in the example, 330px triggers it, 300 does not. If you change the width attribute of the canvas to match the max-width in the style the problem persists.