[storage::hp::3par::ssh::plugin] Request a new mode for 3PAR Adaptive Flash Cache (AFC)
Hello
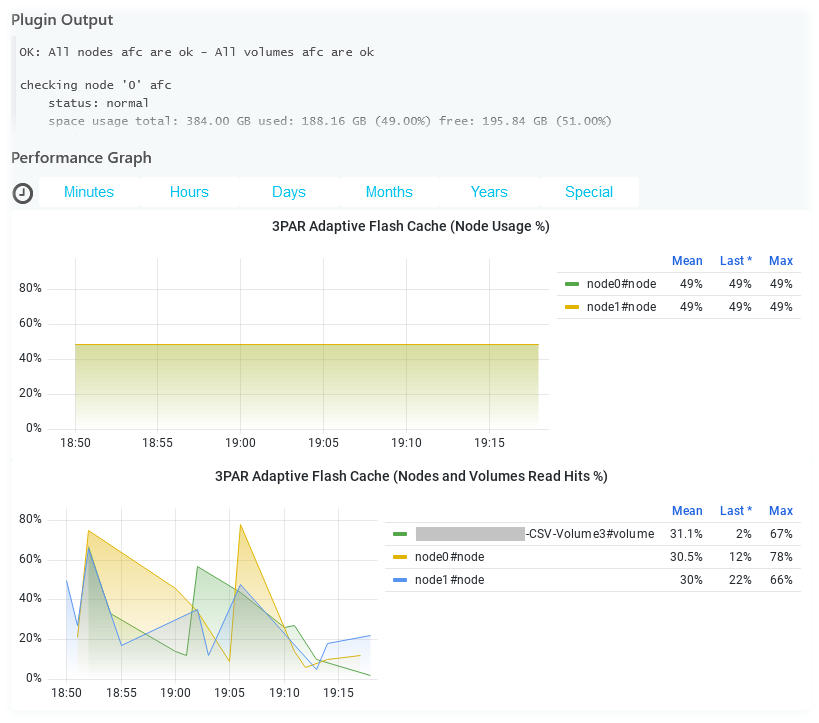
Please make a new mode flashcache in storage::hp::3par::ssh::plugin to check the status and performance of 3PAR Adaptive Flash Cache (AFC).
The first command to be executed showflashcache.
From HPE 3PAR Command Line Interface Reference Guide:
The showflashcache command displays the status of the flash cache for each node or displays the flash cache policy for virtual volumes.
Example:
3PAR01 cli% showflashcache
                  -(MB)-
Node Mode  State     Size Used%
   0 SSD   normal  393216    49
   1 SSD   normal  393216    49
-------------------------------
   2 total         786432
There are 3 important parameters here
- Total flashcache size
- Percentage of flashcache usage
- State of flashcache
Perfdata label like total.flashcache.usage.megabytes may have the following values:
- current size in MB (calculated from total size value and % usage)
- total size in MB (as max in perfdata)
Additional perfdata can be in the context of nodes like node0.flashcache.usage.megabytes, node1.flashcache.usage.megabytes ... nodeX.flashcache.usage.megabytes
The second command (by node request) to be executed statcache -iter 1 -d 1
From HPE 3PAR Command Line Interface Reference Guide:
The statcache command displays Flash cache Memory Page (FMP) and Cache Memory Page (CMP) statistics by node or by virtual volume. ... -iter
Specifies that statistics are displayed a specified number of times as indicated by the number argument using an integer from 1 through 2147483647. -d Specifies the interval, in seconds, that statistics are sampled us is specified, the option defaults to an interval of two seconds -v Specifies that CMP and FMP statistics by virtual volume instead of by node are displayed. By default, all virtual volumes are displayed unless the -n option is specified.
Example:
3PAR01 cli% statcache -iter 1 -d 1
11:01:12 01/27/2022 ------- Current --------    -------- Total ---------
                              CMP  FMP Total              CMP  FMP Total
    Node Type       Accesses Hit% Hit%  Hit%    Accesses Hit% Hit%  Hit%
       0 Read            420   58   21    79         420   58   21    79
       0 Write         12206    2    0     2       12206    2    0     2
       1 Read            574   42    0    42         574   42    0    42
       1 Write         15862    1    0     1       15862    1    0     1

                             Internal Flashcache Activity
                    ----- Current ------     ------- Total --------
Node Type           Accesses  IO/s  MB/s         Accesses IO/s MB/s
   0 Read Back            90    89     1               90   89    1
   0 Destaged Write      425   418     7              425  418    7
   1 Read Back             1     1     0                1    1    0
   1 Destaged Write      592   582    10              592  582   10

     -------------------- FMP Queue Statistics ---------------------
Node Dormant  Cold    Norm   Warm     Hot Destage Read Flush WrtBack
   0 1436749 66143 3748475 778882 6552663       0    0     0       0
   1 1513743 40236 3664236 744859 6619838       0    0     0       0

     ------------------- CMP Queue Statistics --------------------
Node  Free  Clean Write1 WriteN WrtSched Writing DcowPend DcowProc
   0 23772 189078    710    728      435      49        0          1
   1 24413 186667   1477    430      445       0     1374        0
Let's look at the top table "Current". From command help:
Current - Hit% or Accesses during statcache poll period (-d parameter)
Accesses - Number of CMPs and FMPs accessed by Read/Write I/Os
FMP Hit% - Flash cache hits divided accesses displayed in percentage
Here we are interested in the values in the "Read" rows in the "FMP Hit%" column The values in the "Write" rows are not interesting and will always be 0 since 3PAR Adaptive Flash Cache (AFC) is a Read cache.
Additional perfdata can be in the context of nodes like node0.flashcache.readhits.percentage, node1.flashcache.readhits.percentage ... nodeX.flashcache.readhits.percentage (min=0,max=100)
The third command (by virtual volume request) to be executed statcache -iter 1 -d 1 -v
3PAR01 cli% statcache -iter 1 -d 1 -v
                 11:54:57 01/27/2022       ------- Current --------    -------- Total ---------
                                                     CMP  FMP Total              CMP  FMP Total
VVid VVname                          Type  Accesses Hit% Hit%  Hit%    Accesses Hit% Hit%  Hit%
   0 admin                           Read         0    0    0     0           0    0    0     0
   0 admin                           Write        0    0    0     0           0    0    0     0
   1 .srdata                         Read         0    0    0     0           0    0    0     0
   1 .srdata                         Write        0    0    0     0           0    0    0     0
   2 KOM-VMFC-CSV-Volume1            Read        14   21   64    85          14   21   64    85
   2 KOM-VMFC-CSV-Volume1            Write      713   31    0    31         713   31    0    31
   4 .shared.SSD_RAID1_64K_MagAvai_0 Read         0    0    0     0           0    0    0     0
   4 .shared.SSD_RAID1_64K_MagAvai_0 Write        4  100    0   100           4  100    0   100
   5 KOM-VMFC-CSV-Volume2            Read         0    0    0     0           0    0    0     0
   5 KOM-VMFC-CSV-Volume2            Write      171   50    0    50         171   50    0    50

                                                    - Internal Flashcache Activity -
                                                    - Current --        -- Total ---
VVid VVname                          Type               Accesses            Accesses
   0 admin                           Read Back                 0                   0
   0 admin                           Destaged Write            0                   0
   1 .srdata                         Read Back                 0                   0
   1 .srdata                         Destaged Write            0                   0
   2 KOM-VMFC-CSV-Volume1            Read Back                 9                   9
   2 KOM-VMFC-CSV-Volume1            Destaged Write          616                 616
   4 .shared.SSD_RAID1_64K_MagAvai_0 Read Back                 0                   0
   4 .shared.SSD_RAID1_64K_MagAvai_0 Destaged Write            0                   0
   5 KOM-VMFC-CSV-Volume2            Read Back                 0                   0
   5 KOM-VMFC-CSV-Volume2            Destaged Write            0                   0
Let's look at the top table "Current". Here we are interested in the values in the "Read" rows in the "FMP Hit%" column The values in the "Write" rows are not interesting and will always be 0 since 3PAR Adaptive Flash Cache (AFC) is a Read cache.
Additional perfdata can be in the context of nodes like KOM-VMFC-CSV-Volume1#volume.flashcache.readhits.percentage, KOM-VMFC-CSV-Volume2#volume.flashcache.readhits.percentage ... X#volume.flashcache.readhits.percentage (min=0,max=100)
Here we additionally need an option like --filter, which can be used to select only some volumes by name. For example, we need the ability to filter volumes with names like .srdata*, .shared*, admin.
In addition, I can report that I looked at the documentation for WSAPI and I can say that AFC is there, but poorly implemented.
# curl -k -H "X-HP3PAR-WSAPI-SessionKey:0-d5..." 'https://3par01.holding.com:8080/api/v1/flashcache'

{"mode":2,"deviceType":1,"sizeGiB":768,"state":1,"usedSizeGiB":384,"links":[{"href":"https://3par01.holding.com:8080/api/v1/flashcache","rel":"self"}]}
There is some additional data in WSAPI from the System Reporter module. But this method is better not to use. Firstly, System Reporter is a separate licensed component of the embedded 3PAR OS and not everyone has it. Secondly, in fact, System Reporter is recognized as Legacy and EOL and is no longer supported by HPE
I'm still thinking about monitoring the cache.
Perhaps it makes sense to make some kind of general mode for both types of cache - for Flash cache (FMP in statcache output) and Memory cache (CMP in statcache output) . For example, we can call this mode "cache" and make an additional option to be able to filter flashcache / memcache / totalcache.
That is, we assume that the mode will have 3 types of data in perfdata: flashcache data, memcache data, totalcache data (flashcache + memcache). Thus, the mode will contain all the necessary information about the operation of the cache.
That would probably be better.
I have finished!
You can test with following archive: https://github.com/centreon/centreon-plugins/archive/refs/heads/MON-14751-3par-add-modes.zip
https://github.com/centreon/centreon-plugins/pull/3862
Thanks Quentin. Can you add a new plugin to the https://github.com/centreon/centreon-plugins/commits/master branch?