SSO Proxy closes connections even though 200 success is logged
I have configured SSO in kubernetes in front of a service and behind nginx-ingress with proper timeout settings. My service has requests that can be as long as 5 minutes. The logs of sso-proxy says that the requests succeeded (ended in 200) but nginx-ingress says that the upstream (i.e., sso-proxy) prematurely closed the connection.
I don't believe it is a timeout that breaks the connection because sso-proxy seems to say that everything is ok and all the timeouts are configured for 10 minutes.
Edit: see comment below for detailed traces of http requests
From the logs below, it looks like the problem is coming from SSO, but I'm not clear how to debug this further.
Logs from my service:
:03:07.669 [1c6c89ef6fb5b77d](0383ba8aa92c27d85abee89c0f59355c) INFO  c.b.a.s.Backend - Received: POST https://xxxxx.com/api/yyyyy
11:03:07.709 [1c6c89ef6fb5b77d](0383ba8aa92c27d85abee89c0f59355c) INFO  c.b.a.s.p.m.Stuff - Starting computing
11:07:30.982 [1c6c89ef6fb5b77d](0383ba8aa92c27d85abee89c0f59355c) INFO  c.b.a.s.p.m.Stuff - Finished computing
Logs from sso-proxy:
{"action":"proxy","http_status":200,"level":"info","msg":"","remote_address":"10.132.0.7","request_duration":236941.048871,"request_method":"POST","request_uri":"xxxxx.com/api/yyyyy","service":"sso-proxy","time":"2019-01-31 11:11:28.13111","user":"[email protected]","user_agent":"Mozilla/5.0 (X11; Linux x86_64; rv:65.0) Gecko/20100101 Firefox/65.0"}
Logs from nginx-ingress:
2019/01/31 11:03:07 [warn] 319#319: *3111 a client request body is buffered to a temporary file /tmp/client-body/0000000005, client: 10.4.1.1, server: xxxxx.com, request: "POST /api/yyyyy HTTP/2.0", host: "xxxxx.com", referrer: "https://xxxxx.com/page"
2019/01/31 11:07:31 [error] 319#319: *3111 upstream prematurely closed connection while reading response header from upstream, client: 10.4.1.1, server: xxxxx.com, request: "POST /api/yyyyy HTTP/2.0", upstream: "http://10.4.1.65:4180/api/yyyyy", host: "xxxxx.com", referrer: "https://xxxxx.com/page"
The ingress has the following annotation:
nginx.ingress.kubernetes.io/proxy-read-timeout: "600"
nginx.ingress.kubernetes.io/proxy-send-timeout: "600"
And the SSO upstream configuration has the following:
    - service: demo-svc
      default:
        from: xxxxx.com
        to: http://demo-svc.demo-ns.svc.cluster.local:80
        options:
          # same as nginx proxy-read-timeout above
          timeout: 10m
As a complement, I did more tests and I can confirm something strange is happening at sso-proxy level.
I ran tcpdump (https://serverfault.com/a/633452/485141) on the container of my application and on the container of sso-proxy, and this is what happens in total:
- nginx-ingress receives request and passes it to sso-proxy:
2019/02/08 11:15:12 [warn] 904#904: *2356042 a client request body is buffered to a temporary file /tmp/client-body/0000000011, client: 10.132.0.7, server: xxxxx.com, request: "POST /api/yyyyy HTTP/2.0", host: "xxxxx.com", referrer: "https://xxxxx.com/page"
- sso-proxy receives request and passes it to my application:
POST /api/yyyyy HTTP/1.1
Host: xxxxx.com/api/yyyyy
X-Request-ID: d0e8f4137b37017ded2a8d65208cd4f9
X-Real-IP: 10.132.0.7
X-Forwarded-For: 10.132.0.7
X-Forwarded-Host: xxxxx.com/api/yyyyy
X-Forwarded-Port: 443
X-Forwarded-Proto: https
X-Original-URI: /api/yyyyy
X-Scheme: https
Content-Length: 10966
user-agent: Mozilla/5.0 (X11; Linux x86_64; rv:65.0) Gecko/20100101 Firefox/65.0
accept: application/json, text/plain, */*
accept-language: en-US,en;q=0.5
accept-encoding: gzip, deflate, br
referer: https://xxxxx.com/page
authorization: Bearer
content-type: application/json
dnt: 1
cookie: _sso_proxy=xxxxxxxxxxxxxxxxxxxxxx
- my application receives the request:
POST /api/yyyyy HTTP/1.1
Host: demo-svc.demo-ns.svc.cluster.local:80
User-Agent: Mozilla/5.0 (X11; Linux x86_64; rv:65.0) Gecko/20100101 Firefox/65.0
Content-Length: 10966
Accept: application/json, text/plain, */*
Accept-Encoding: gzip, deflate, br
Accept-Language: en-US,en;q=0.5
Authorization: Bearer
Content-Type: application/json
Cookie:
Dnt: 1
referer: https://xxxxx.com/page
X-Forwarded-Email: [email protected]
X-Forwarded-For: 10.132.0.7, 10.4.1.73
X-Forwarded-Groups:
X-Forwarded-Host: xxxxx.com/api/yyyyy
X-Forwarded-Host: xxxxx.com/api/yyyyy
X-Forwarded-Port: 443
X-Forwarded-Proto: https
X-Forwarded-User: me
X-Original-Uri: /api/yyyyy
X-Real-Ip: 10.132.0.7
X-Request-Id: d0e8f4137b37017ded2a8d65208cd4f9
X-Scheme: https
- my application computes for 4 minutes and 5 seconds and answers:
HTTP/1.1 200 OK
Date: Fri, 08 Feb 2019 11:15:12 GMT
X-Request-ID: d0e8f4137b37017ded2a8d65208cd4f9
X-Response-ID: fa767e13ee3cdaa2
Access-Control-Allow-Origin: *
Content-Type: application/json;charset=utf-8
Transfer-Encoding: chunked
Server: Jetty(9.4.12.v20180830)
- sso-proxy reports the response in its logs but in practice (tcpdump, does nothing):
{"action":"proxy","http_status":200,"level":"info","msg":"","remote_address":"10.132.0.7","request_duration":244697.989488,"request_method":"POST","request_uri":"xxxxx.com/api/yyyyy","service":"sso-proxy","time":"2019-02-08 11:19:17.2811","user":"[email protected]","user_agent":"Mozilla/5.0 (X11; Linux x86_64; rv:65.0) Gecko/20100101 Firefox/65.0"}
{"allowed_groups":null,"level":"info","msg":"validating groups","service":"sso-proxy","time":"2019-02-08 11:19:17.2811","user":"[email protected]"}
- nginx-ingress reports a closed connection:
10.132.0.7 - [10.132.0.7] - - [08/Feb/2019:11:19:17 +0000] "POST /api/yyyyy HTTP/2.0" 502 157 "https://xxxxx.com/page" "Mozilla/5.0 (X11; Linux x86_64; rv:65.0) Gecko/20100101 Firefox/65.0" 11592 244.719 [proxy-proxy-buzzfeed-sso-proxy-http] 10.4.1.84:4180 0 244.713 502 d0e8f4137b37017ded2a8d65208cd4f9
2019/02/08 11:19:17 [error] 904#904: *2356042 upstream prematurely closed connection while reading response header from upstream, client: 10.132.0.7, server: xxxxx.com, request: "POST /api/yyyyy HTTP/2.0", upstream: "http://10.4.1.84:4180/api/yyyyy", host: "xxxxx.com", referrer: "https://xxxxx.com/page"
To increase visibility of this, @loganmeetsworld @jphines pinging you since you handled so nicely the previous bug I reported ;)
@victornoel I didn't get as much time to get to this today as I would have liked -- and I'm in a bit of rush now, so I'll be brief.
If I had to guess, it seems like a flushing issue on Transfer-Encoding: chunked where sso proxy isn't flushing at the appropriate interval.
I'm curious if you set https://github.com/buzzfeed/sso/blob/master/docs/sso_config.md#sso_proxy flush_interval to some small window if this behavior improves/changes.
I'll pick up my investigation of this tomorrow. Thanks for the bug report!
@jphines I can test yes, but I can't find the default value for flush_interval, what would be a small value?
@jphines I've tried with 10s and it doesn't change the situation. Same think with 1 second :/
@jphines have you had the time to explore more? I can do some more debug, but honestly, I haven't even found how to enable some debug logging :) if you have some ideas as to what I could check out I can do more tests and report my findings!
@jphines this is all the output I have, the processes are running in docker containers in kubernetes for the record. maybe there is some way to add more debug output?
@jphines hi, have you had the opportunity to explore this further or had some idea on how I could help debug/workaround this?
Hi @jphines do you have an idea of when you will be able to look at this? We are quite blocked by it and it would help us at least to know what to expect :) Thanks!
@victornoel I got to dig into this tonight for a couple of hours. I was able to reproduce pretty easily and found 30s to be a magic number. Below this, requests seem to work fine. Above this threshold, requests wouldn't seem to respond.
I have a log debugging saga I'd love to share but it'd be pretty vain. In favor of brevity, I'm pretty sure this due to the defaults we set on the http.Sever with which we accept TCP connections here:
https://github.com/buzzfeed/sso/blob/master/cmd/sso-proxy/main.go#L49:L54
It's worth noting, we set 30s as defaults for both TCP Reads and Writes. I'd suggest trying to extend these timeouts https://github.com/buzzfeed/sso/blob/master/internal/proxy/options.go#L73:L74 to something that makes sense for your environment i.e. beyond 5 minutes.
https://play.golang.org/p/nqU9hBf1mkT is a straight forward example I cooked up that demostrates this case in a few lines of code.
@jphines so you mean that on top of configuring a timeout per upstream, I also need to mirror this setting via the two tcp read and write options (that are global) so that they are greater than the max of the timeouts I need?
I tried with all the timeouts (read, write and upstream) to 10m and it seems to work.
From there I think there are two things that can be done:
- to not log success and silently fail in the case the http server timeouts at that level (so that we avoid taking your time to investigate things like this ;)
- maybe using the max of the upstream timeouts instead of the default?
Thanks again for finding the solution and sorry it was something so trivial
Hope you don't mind me chiming in here but this is also something I've been bit by. More generally, timeouts (and their defaults!) are something I think is tricky and worry about as well.
As far as I understand,
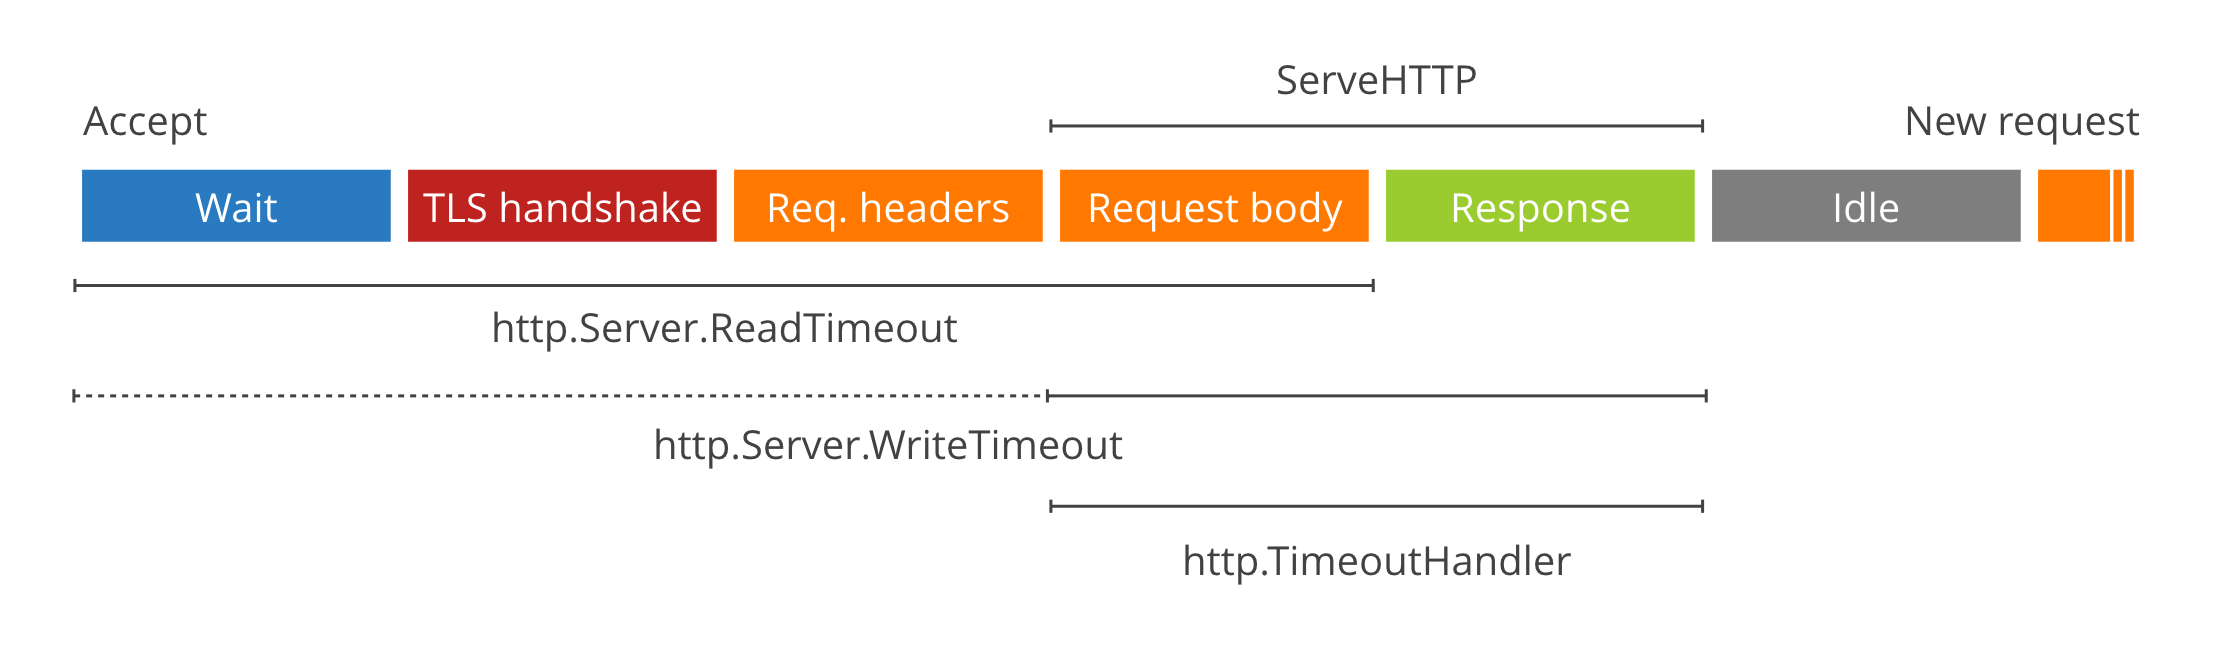
-
WriteTimeoutincludesReadTimeoutwhen it is a TLS request. - On error
http.TimeoutHandlerdoesn't actually return the timeout message set, but ratherhttp: proxy error: context deadline exceeded. This one has bit me a few times in testing. Neither pomerium or sso implement/pass our custom loggers into the proxy right now so we end up getting standard logger output). -
WriteTimeoutset to 0 can be abused to exhaust file descriptors. - Streaming requests requires that
WriteTimeoutbe set 0. That would suggest that if any of your sub-routes requires streaming, your top-levelhttp.Serverconfig will have to necessarily have aWriteTimeoutof 0. - The main http server
WriteTimeouteffectively overlaps with the individual host'shttp.TimeoutHandlertimeout.
I think your approach (#163 ) makes a lot of sense, but do you imagine that in practice most users will end up setting WriteTimeout to 0 in order to support an endpoint that may require streaming?