Bref Dashboard feedback issue
Run the Bref Dashboard in a project:
vendor/bin/bref dashboard
If you have any questions or feedback regarding the Bref Dashboard, please write a comment here :)
bin/bref dashboard
Stack: yprox-keyword-dev (eu-west-2)
[ERROR] The command `docker pull bref/dashboard` failed
docker -v
Docker version 18.09.2, build 6247962
I don't know if i'm missing something :)
Thanks that's curious. Could you try running the command manually? docker pull bref/dashboard
It worked using docker pull bref/dashboard:
Using default tag: latest
latest: Pulling from bref/dashboard
050382585609: Pull complete
e880c35ca90c: Pull complete
8ef96ce51793: Pull complete
7ad1c877c150: Pull complete
6b62a2a75425: Pull complete
006f8296597d: Pull complete
8ec746b4c342: Pull complete
842943903192: Pull complete
6af0f8d10e79: Pull complete
b5c892ee4c80: Pull complete
Digest: sha256:646891851d00054be9fa47da04b10c419c1865cbfc7f10784ff937a9859887f8
Status: Downloaded newer image for bref/dashboard:latest
OK, I've spotted #400 which is why you didn't have more details. And maybe the command timed out (I've disabled it). Is the dashboard working now?
The dashboard is running; If you want I can remove the image when a new version is tagged and start "fresh" to see if there's an issue;
Maybe a good thing if the docker pulling image is not "reliable" is to give the manual command in the error message; something like "you can try downloading the image manually by running ducker pull ...
Some ideas:
-
Live tail for logs, (doing long polling) so we can see and real time (or so) the logs coming; (even an automatic refresh each 5 sec is great)
-
Refresh button
-
Ability to copy the output without the timestamp on the right-
-
add the bref.sh favicon
-
is the dashboard multi function ready (even if they live in another directory?)
-
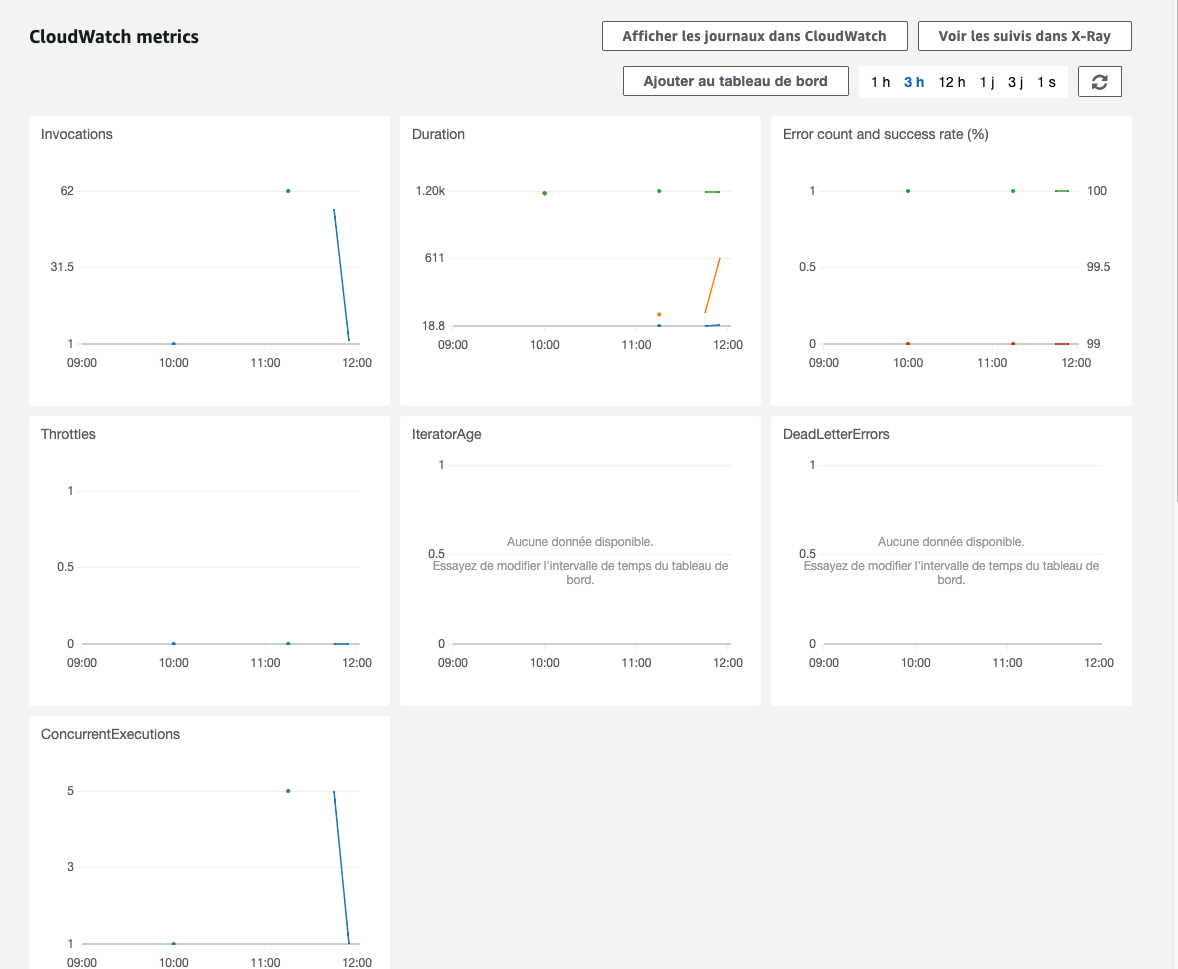
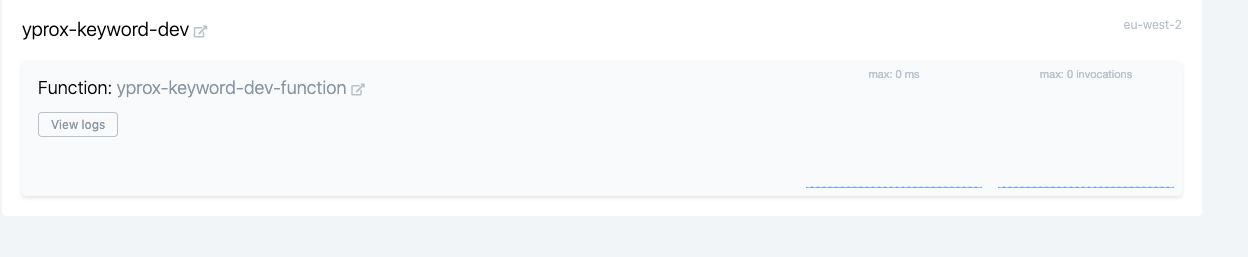
Add more metric like serverless dashboard so we don't need the serverless dashboard anymore :D
-
the metric doesn't seem to work. I got 0 invocations and 0 ms when I got data on the CloudWatch metrics:
Otherwise, great work !
Also, even if we use 1hour timeframe, the output is only a small percent of the available logs.
Also, even if we use 1hour timeframe, the output is only a small percent of the available logs.
Oh yes! I forgot to add a notice, it's only the latest 100 lines! I need to add something there.
Nice stuff, thanks! One issue - the output when I start the dashboard is:
Dashboard started: http://localhost:8000
But in the dockerfile, PHP is started with:
CMD ["php", "-S", "0.0.0.0:8000"]
So the PHP webserver listens on all host IPs, not only on localhost. This is great, because I'm using a development server different from localhost, but the output is confusing. I searched the help text for the option to change the IP address binding, but didn't find this.
Kind regards, Ralf
@geschke you mean you would like to change the text that is displayed in the output? To be honest if it's just that, I'd rather let people type the correct IP address in their browser because it will be hard/impossible to guess what the proper IP address is for their server.
@mnapoli You decide! :-)
I was confused, because it says localhost, so I thought it listens on localhost only and would not be reachable from another client in the network. So i searched for an option the change the IP as in the internal PHP webserver, Symfony development server and similar.
If I run the php webserver with -S localhost:3000, only clients on localhost get access. In the opposite, if it runs with -S 0.0.0.0:3000 it runs on any IP. The simplest approach is to change the output "localhost" to "0.0.0.0", so the user will be informed about the real behavior. Maybe you can extend the dashboard command in future and add an option --host=HOST [default: localhost], so the user can choose the IP address.
OK so this isn't what I understood from your previous message.
Can you confirm that the dashboard doesn't work when accessing from another host?
Please have a look at my pull request. This should implement the behavior I expected. Default "localhost" (or 127.0.0.1) listens only on the same host. If an IP address is submitted (e.g. --host=192.168.1.1), it converts to "docker run -p 192.168.1.1:8000:8000", so the dashboard server is reachable within the network. In my first message I have failed to notice that you're using Docker and the run command to start the dashboard, so the issue will be resolved by modifying the docker run parameters.
Hey everyone! I got some updates regarding the Bref Dashboard.
I pushed an entirely rewritten version that focuses on logs for the moment. The UI is much more enjoyable to use (much faster) and has new features:
- live tailing (finally!)
- allows to watch the logs of all functions at once! (I do not know of any other Lambda log visualiser that does this)
- displays the "request ID" extracted from the logs as a clickable link: click that and see the logs from a specific request (that requires the request ID to be included in the logs, that's something I am working on)
- JSON content from logs are formatted
- Fatal errors are recognized and shown in red
Let me know what you think!
Note: at the moment if you run vendor/bin/bref dashboard, the command will seem to run forever. The dashboard will be running however, just visit http://127.0.0.1:8000/ to view it. I'll tag a release to fix that.
source repository on this page is a 404 https://hub.docker.com/r/bref/dashboard
@smknstd not sure what you mean, is there a problem when running the dashboard? If you are looking for the actual source code of the dashboard it isn't open-source.
Yes I was looking for the source code and saw this link https://www.github.com/mnapoli/bref-dashboard . Sorry to have bothered you. Have a good day.
No worries, I see how that can be confusing indeed!
BTW everyone, I've been working a lot on the Dashboard, I'm deploying new exciting stuff right now. Check it out and let me know what you think.
Closing this:
- The Dashboard has been released -> https://dashboard.bref.sh/
- All feedback is now collected here: https://github.com/brefphp/dashboard