Slightly incorrect stack trace in release (with debug info) mode
Here is the sample code that reproduces the issue: #define BACKWARD_HAS_DW 1
//... includes above
#define BACKWARD_HAS_DW 1
using namespace backward;
void print(ResolvedTrace& trace)
{
for (auto& loc : trace.inliners)
std::cout
<< " " << loc.filename
<< " " << loc.function
<< ": "
<< loc.line
<< std::endl;
}
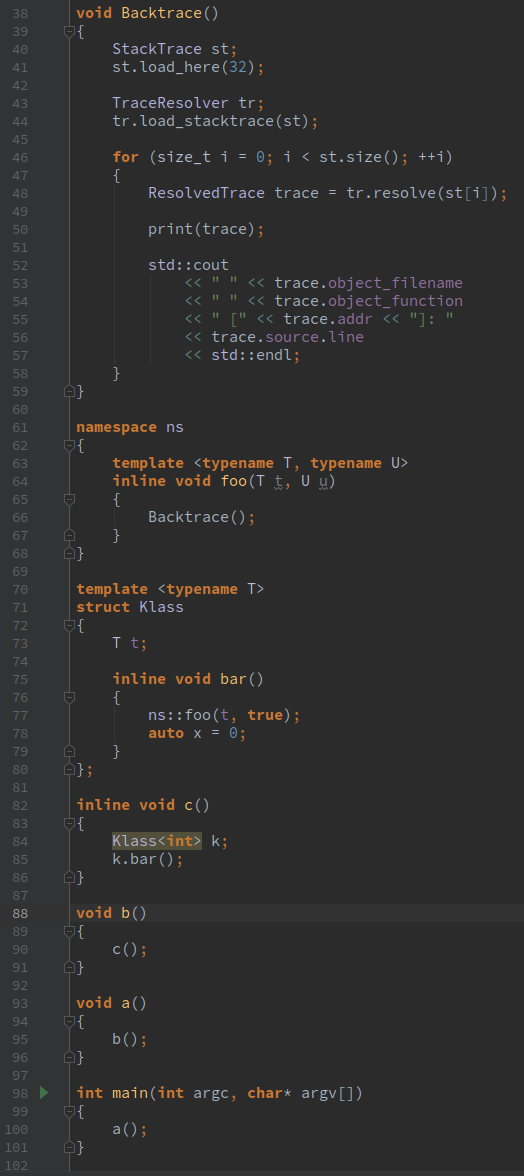
void Backtrace()
{
StackTrace st;
st.load_here(32);
TraceResolver tr;
tr.load_stacktrace(st);
for (size_t i = 0; i < st.size(); ++i)
{
ResolvedTrace trace = tr.resolve(st[i]);
print(trace);
std::cout
<< " " << trace.object_filename
<< " " << trace.object_function
<< " [" << trace.addr << "]: "
<< trace.source.line
<< std::endl;
}
}
namespace ns
{
template <typename T, typename U>
inline void foo(T t, U u)
{
Backtrace();
}
}
template <typename T>
struct Klass
{
T t;
inline void bar()
{
ns::foo(t, true);
auto x = 0;
}
};
inline void c()
{
Klass<int> k;
k.bar();
}
void b()
{
c();
}
void a()
{
b();
}
int main(int argc, char* argv[])
{
a();
}
The stack trace it produces (removed not interesting info) is:
sample Backtrace() [0x559733a2e67a]: 41 sample/src/test.cpp foo<int, bool>: 77 sample/src/test.cpp bar: 85 sample/src/test.cpp c: 90 sample/src/test.cpp b: 95 sample/src/test.cpp a: 100 sample main [0x559733a2e258]: 66
line 41 is inside Backtrace - ok line 77 is inside bar() - reported foo<int, bool> line 85 is inside c() - reported bar() line 90 is inside b() - reported c() etc ...
It looks like it is shifted (inlined functions). Works perfectly in debug. Not sure if interpret it correctely though.
are you using unwind for walking the stack?
what platform, os, compiler are you using
On Wed, Nov 28, 2018, 12:23 Alexandre Anoutchine <[email protected] wrote:
Here is the sample code that reproduces the issue: #define BACKWARD_HAS_DW 1
//... includes above #define BACKWARD_HAS_DW 1using namespace backward; void print(ResolvedTrace& trace) { for (auto& loc : trace.inliners) std::cout << " " << loc.filename << " " << loc.function << ": " << loc.line << std::endl; } void Backtrace() { StackTrace st; st.load_here(32);
TraceResolver tr;
tr.load_stacktrace(st);

for (size_t i = 0; i < st.size(); ++i)
{
    ResolvedTrace trace = tr.resolve(st[i]);

    print(trace);

    std::cout
        << " " << trace.object_filename
        << " " << trace.object_function
        << " [" << trace.addr << "]: "
        << trace.source.line
        << std::endl;
}
} namespace ns { template <typename T, typename U> inline void foo(T t, U u) { Backtrace(); } } template <typename T>struct Klass { T t;
inline void bar()
{
    ns::foo(t, true);
    auto x = 0;
}
}; inline void c() { Klass
k; k.bar(); } void b() { c(); } void a() { b(); } int main(int argc, char* argv[]) { a(); } [image: screenshot] https://user-images.githubusercontent.com/417876/49179983-d4a1aa80-f353-11e8-822d-9a054d4549d0.png
The stack trace it produces (removed not interesting info) is:
sample Backtrace() [0x559733a2e67a]: 41 sample/src/test.cpp foo<int, bool>: 77 sample/src/test.cpp bar: 85 sample/src/test.cpp c: 90 sample/src/test.cpp b: 95 sample/src/test.cpp a: 100 sample main [0x559733a2e258]: 66
line 41 is inside Backtrace - ok line 77 is inside bar() - reported foo<int, bool> line 85 is inside c() - reported bar() line 90 is inside b() - reported c() etc ...
It looks like it is shifted (inlined functions). Works perfectly in debug. Not sure if interpret it correctely though.
— You are receiving this because you are subscribed to this thread. Reply to this email directly, view it on GitHub https://github.com/bombela/backward-cpp/issues/130, or mute the thread https://github.com/notifications/unsubscribe-auth/AANMjNT2pdV0UMx970u5_z3wyXEOTUOKks5uzvDcgaJpZM4Y4X3m .
Yes, unwind (dw, elf) Ubuntu 18.04.1 x86_64 gcc (Ubuntu 7.3.0-27ubuntu1~18.04) 7.3.0
It seems that for inlined functions the line number doesn't correspond to the function name.
struct inliners_search_cb {
...
 case DW_TAG_inlined_subroutine:
	ResolvedTrace::SourceLoc sloc;
	Dwarf_Attribute attr_mem;

	if ((name = dwarf_diename(die))) {
		sloc.function = name;
	}
	if ((name = die_call_file(die))) {
		sloc.filename = name;
	}

	Dwarf_Word line = 0, col = 0;
	dwarf_formudata(dwarf_attr(die, DW_AT_call_line, &attr_mem), &line);
So the function name it reports doesn't correspond to the line number. It is like it is shifted for the function names but the line numbers are correct. Any idea what might be wrong ?
By the way, is it possible to have demangled names for the inline functions ? (I'm using elfutils)
As far as I can tell the code relies on the information from the die. Could it be in your case the https://github.com/bombela/backward-cpp/blob/master/backward.hpp#L2759 branch is taken and behaves wrong?
Dwarf function names are not mangled. Only object information (used as fallback) are mangled though, and we demangle them as best as we can.