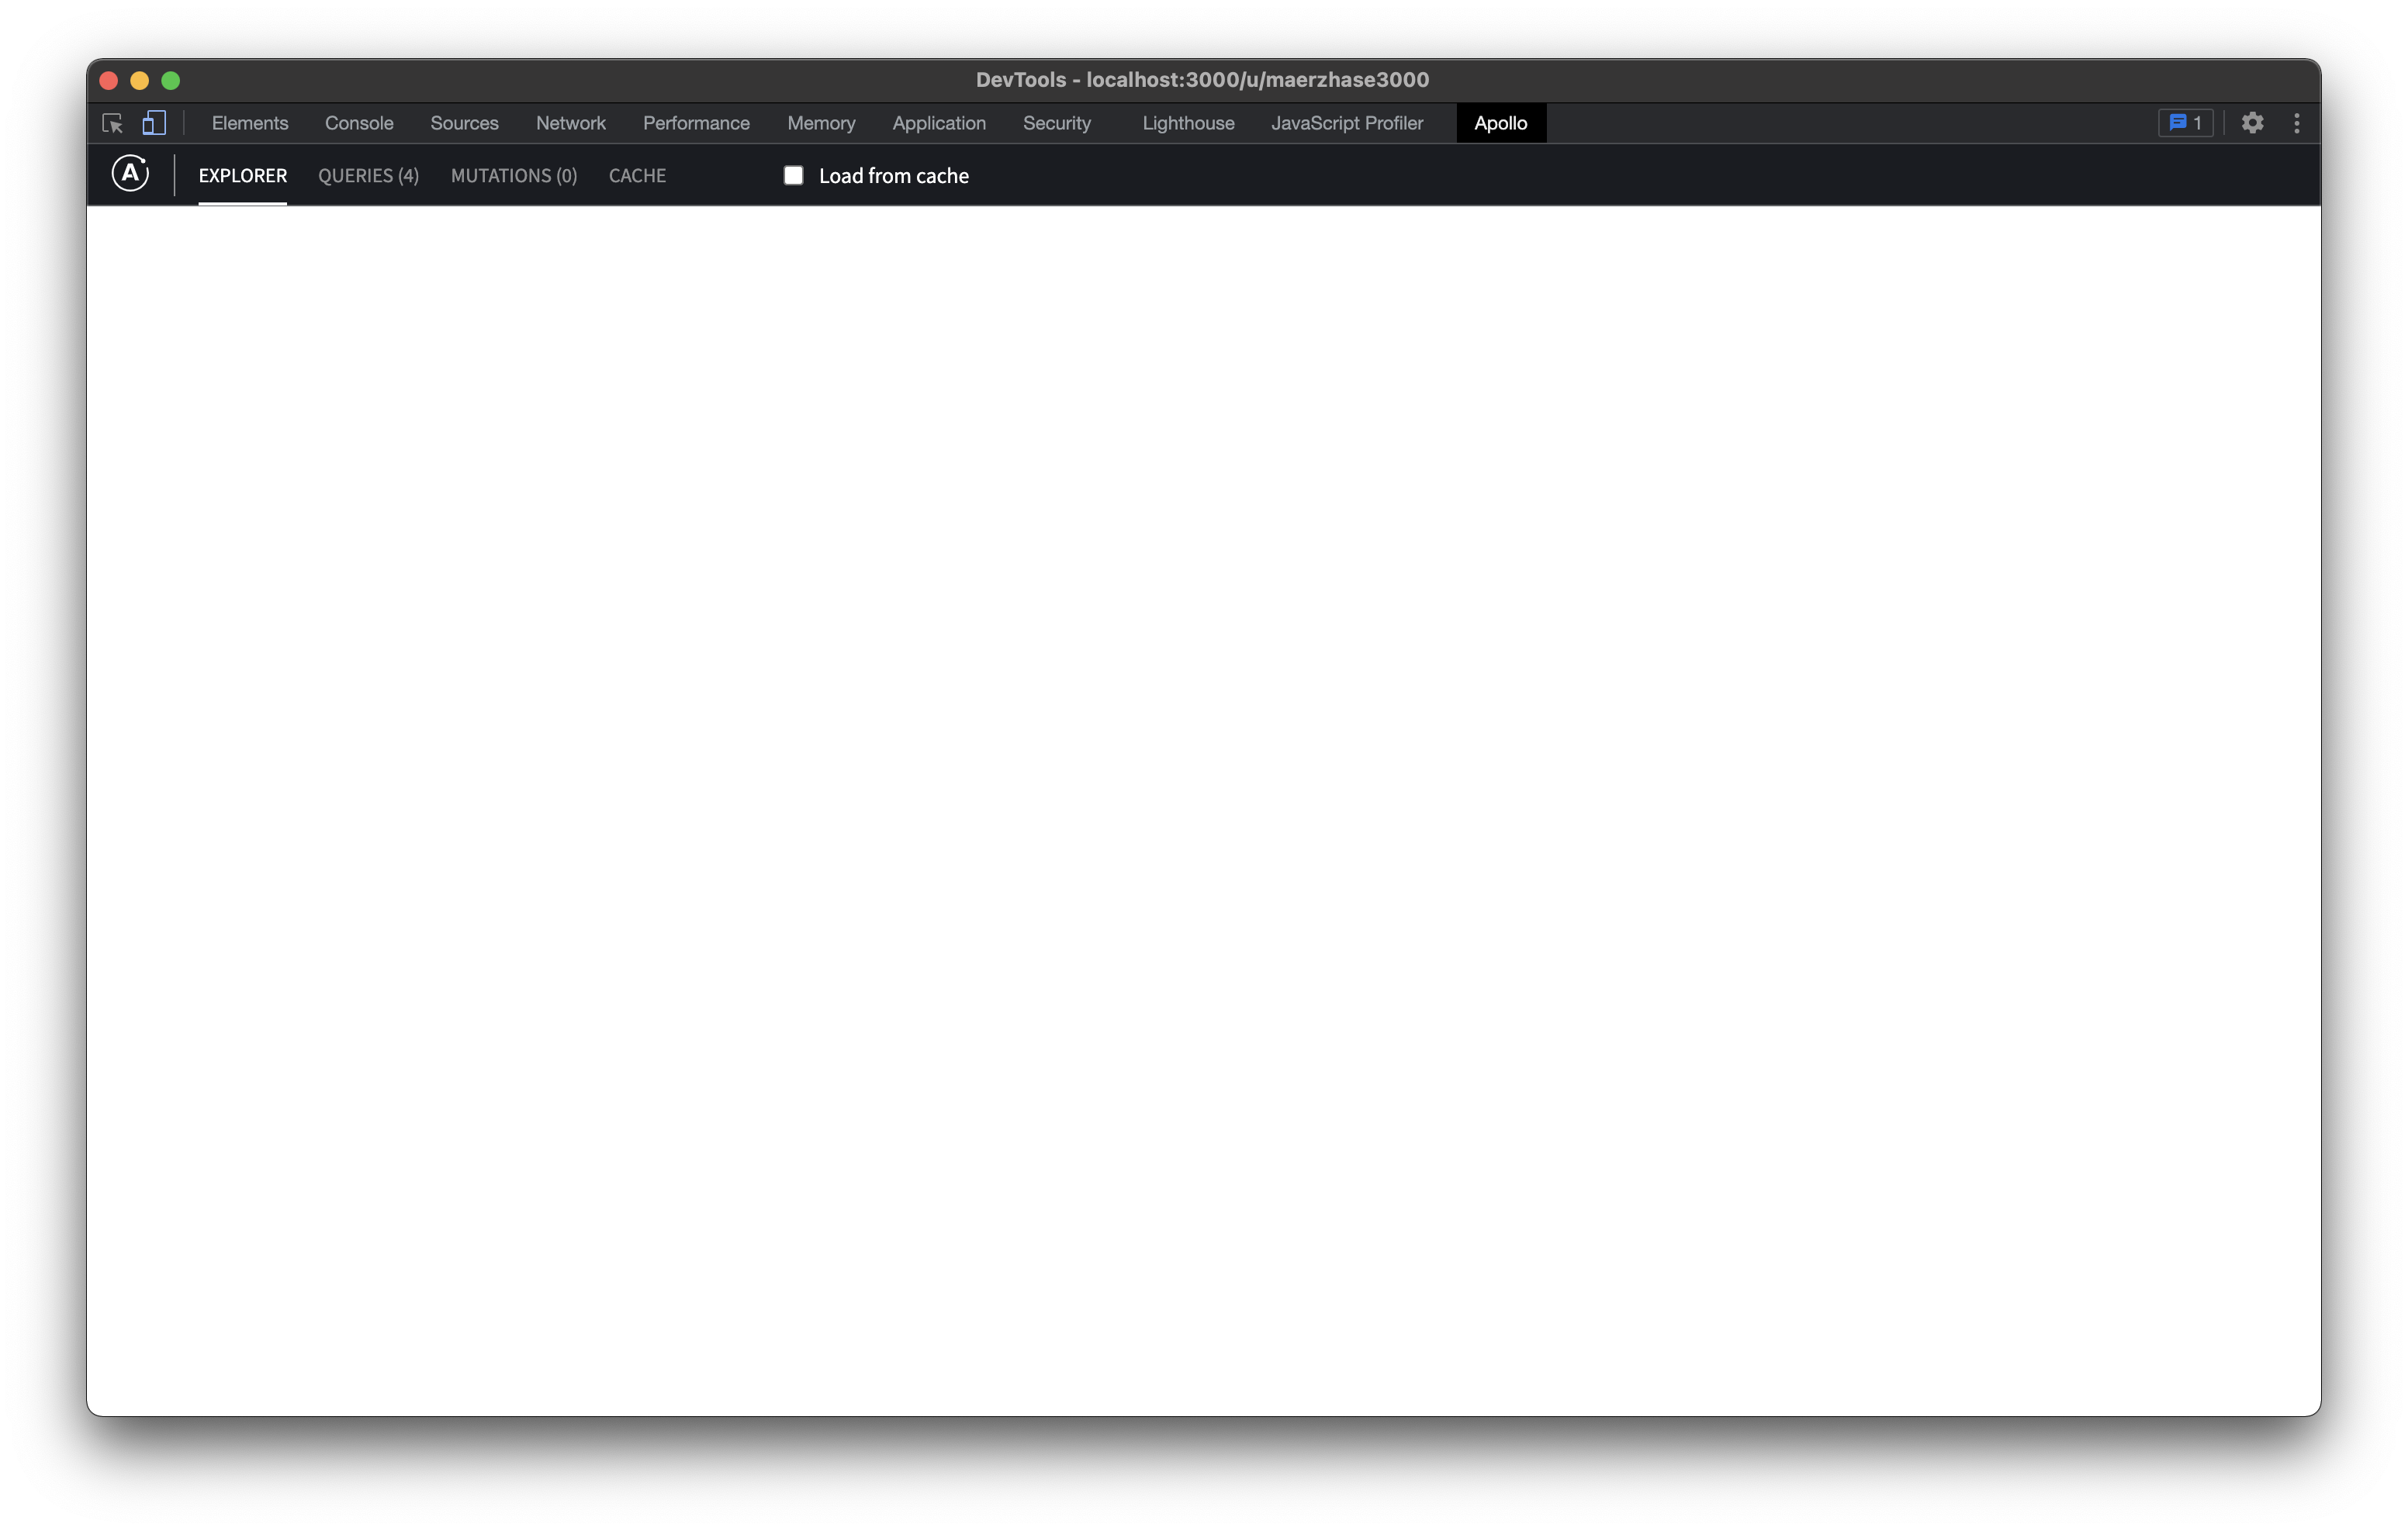
Explorer remains blank
No matter what I do the explorer tab remains blank. I happens on Brave, Chrome and Firefox freshly installed browser + plugin. Devtools can connect with the client. I do see the queries etc. but the Explorer remains blank.
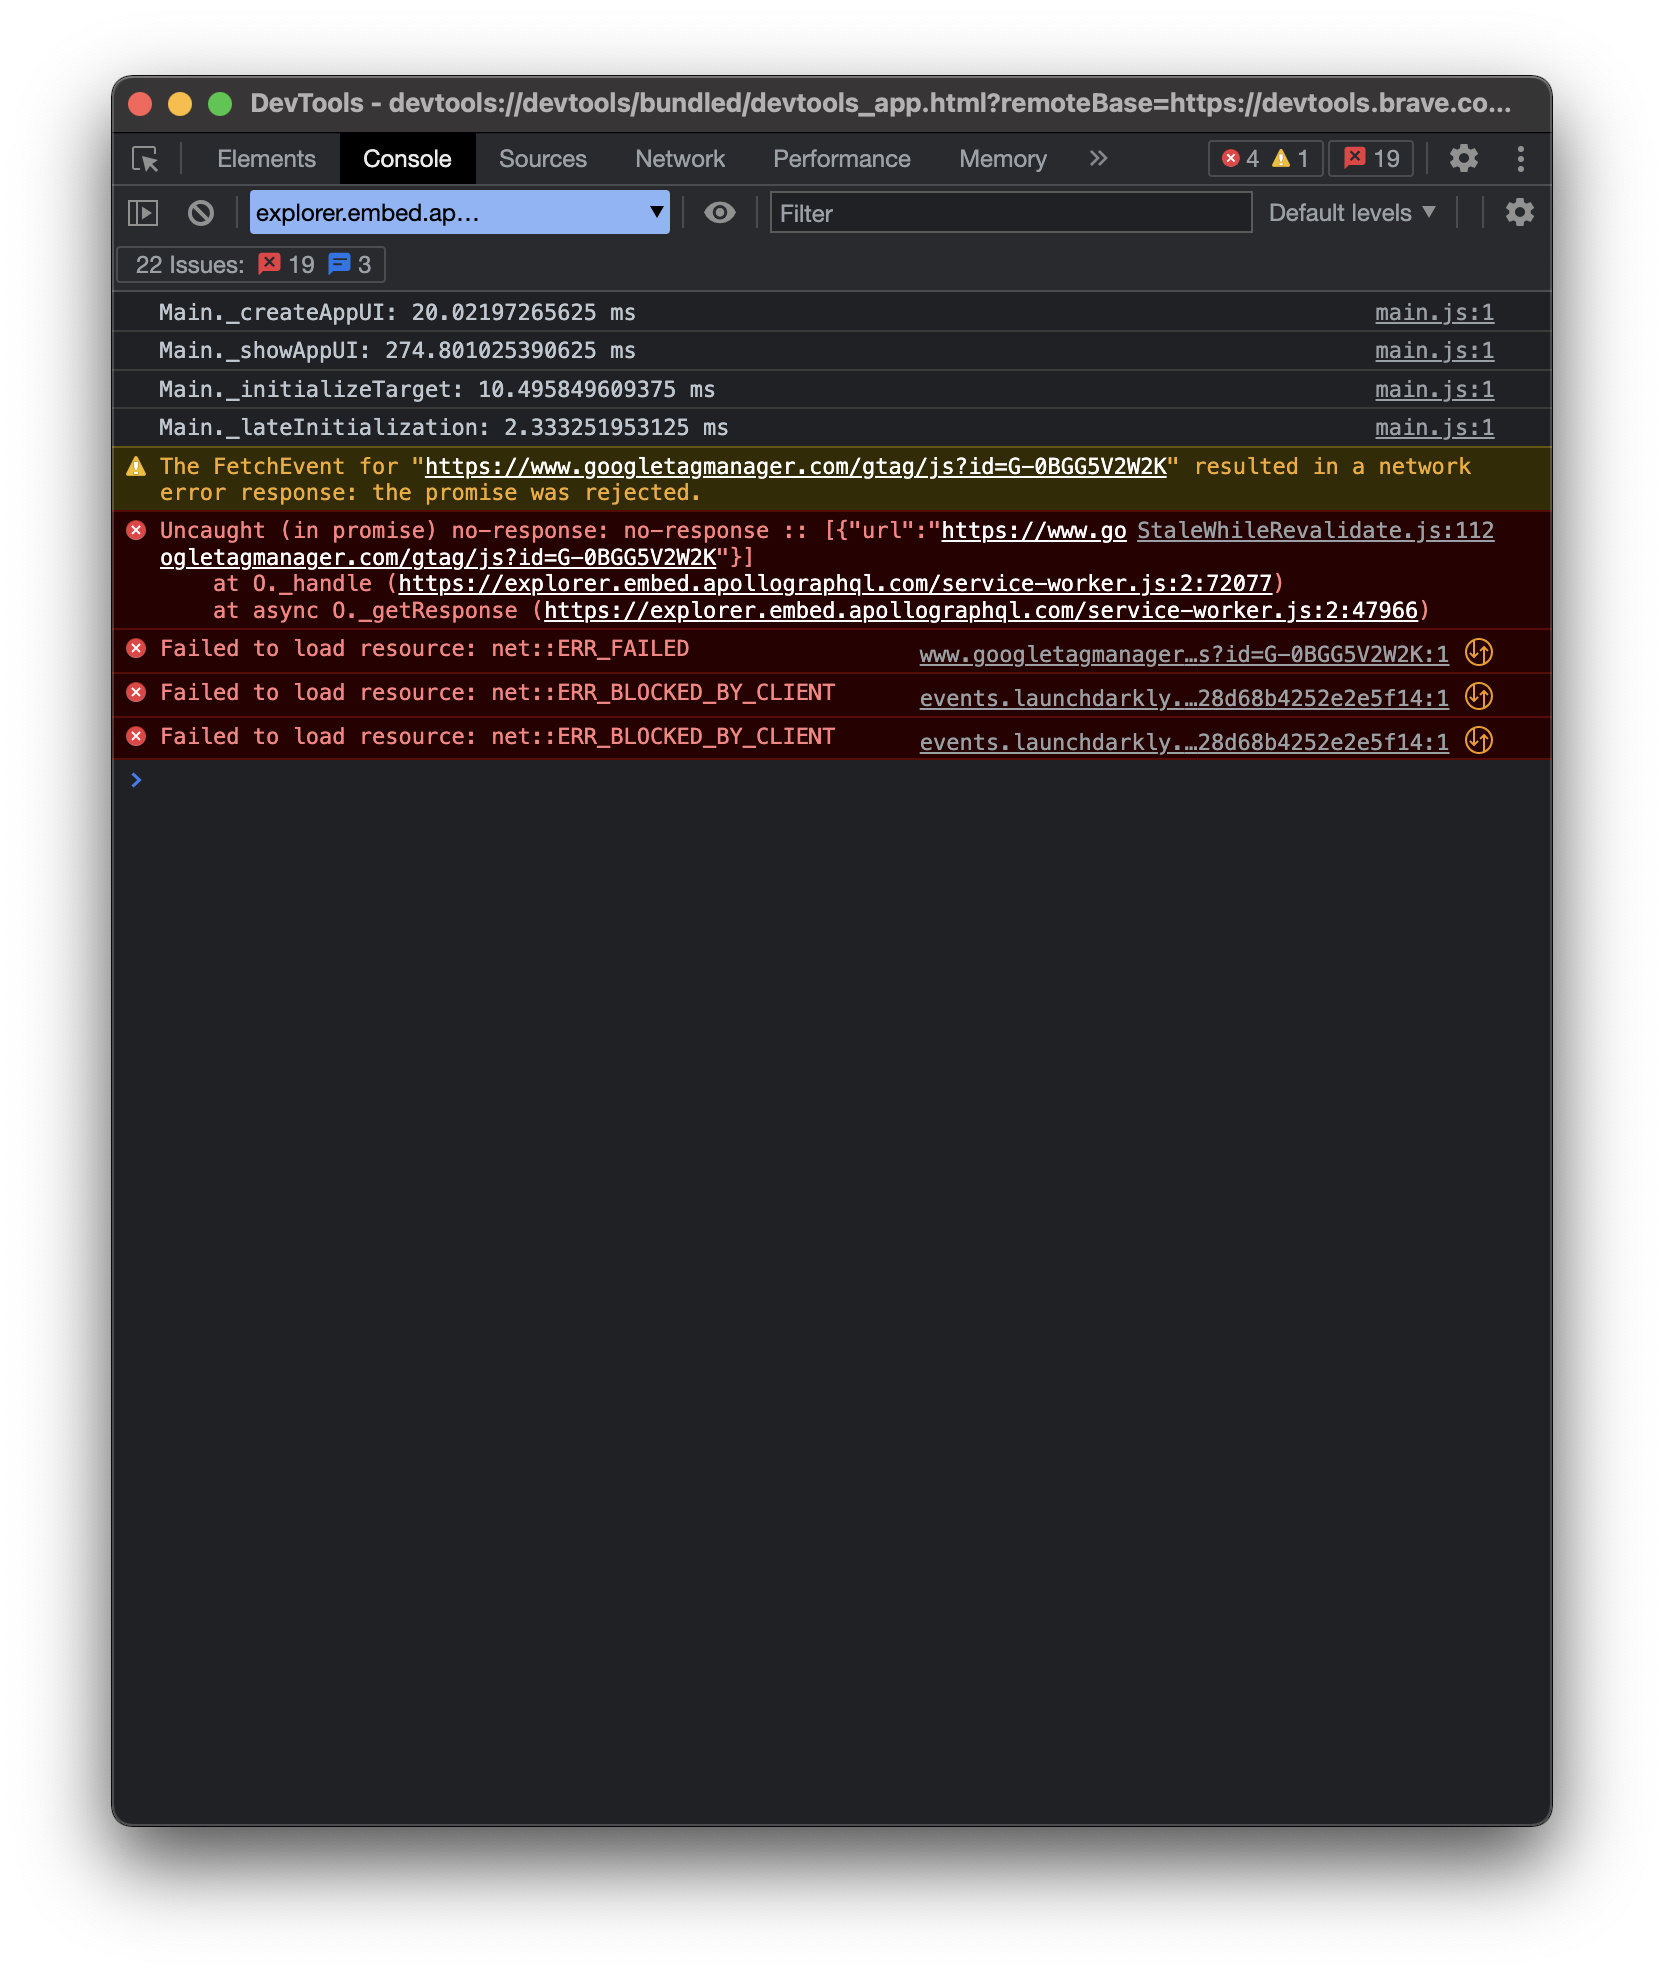
It all worked fine last week and it happend out of the blue. Nothing changed on my machine. It kindof seems similar to what #823 although i dont see the same failed network calls. The errors in the console seem to be only related to google tag manager being blocked... I disabled all content blockers...
Intended outcome: Expect my queries via explorer.
Actual outcome: Explorer remains blank, although queries are visible so devtools are connected.
How to reproduce the issue: I am not sure how to reproduce it, but on my machine currently happens on all browsers
Desktop:
- OS: macOS big sur 11.5.2
- Browser Brave 1.38.109, Firefox 99.0.1, Chrome 101.0.4951.41
- Extension version 4.0
When enforce "light-mode" at least I see a loading spinner that never finishes :-)
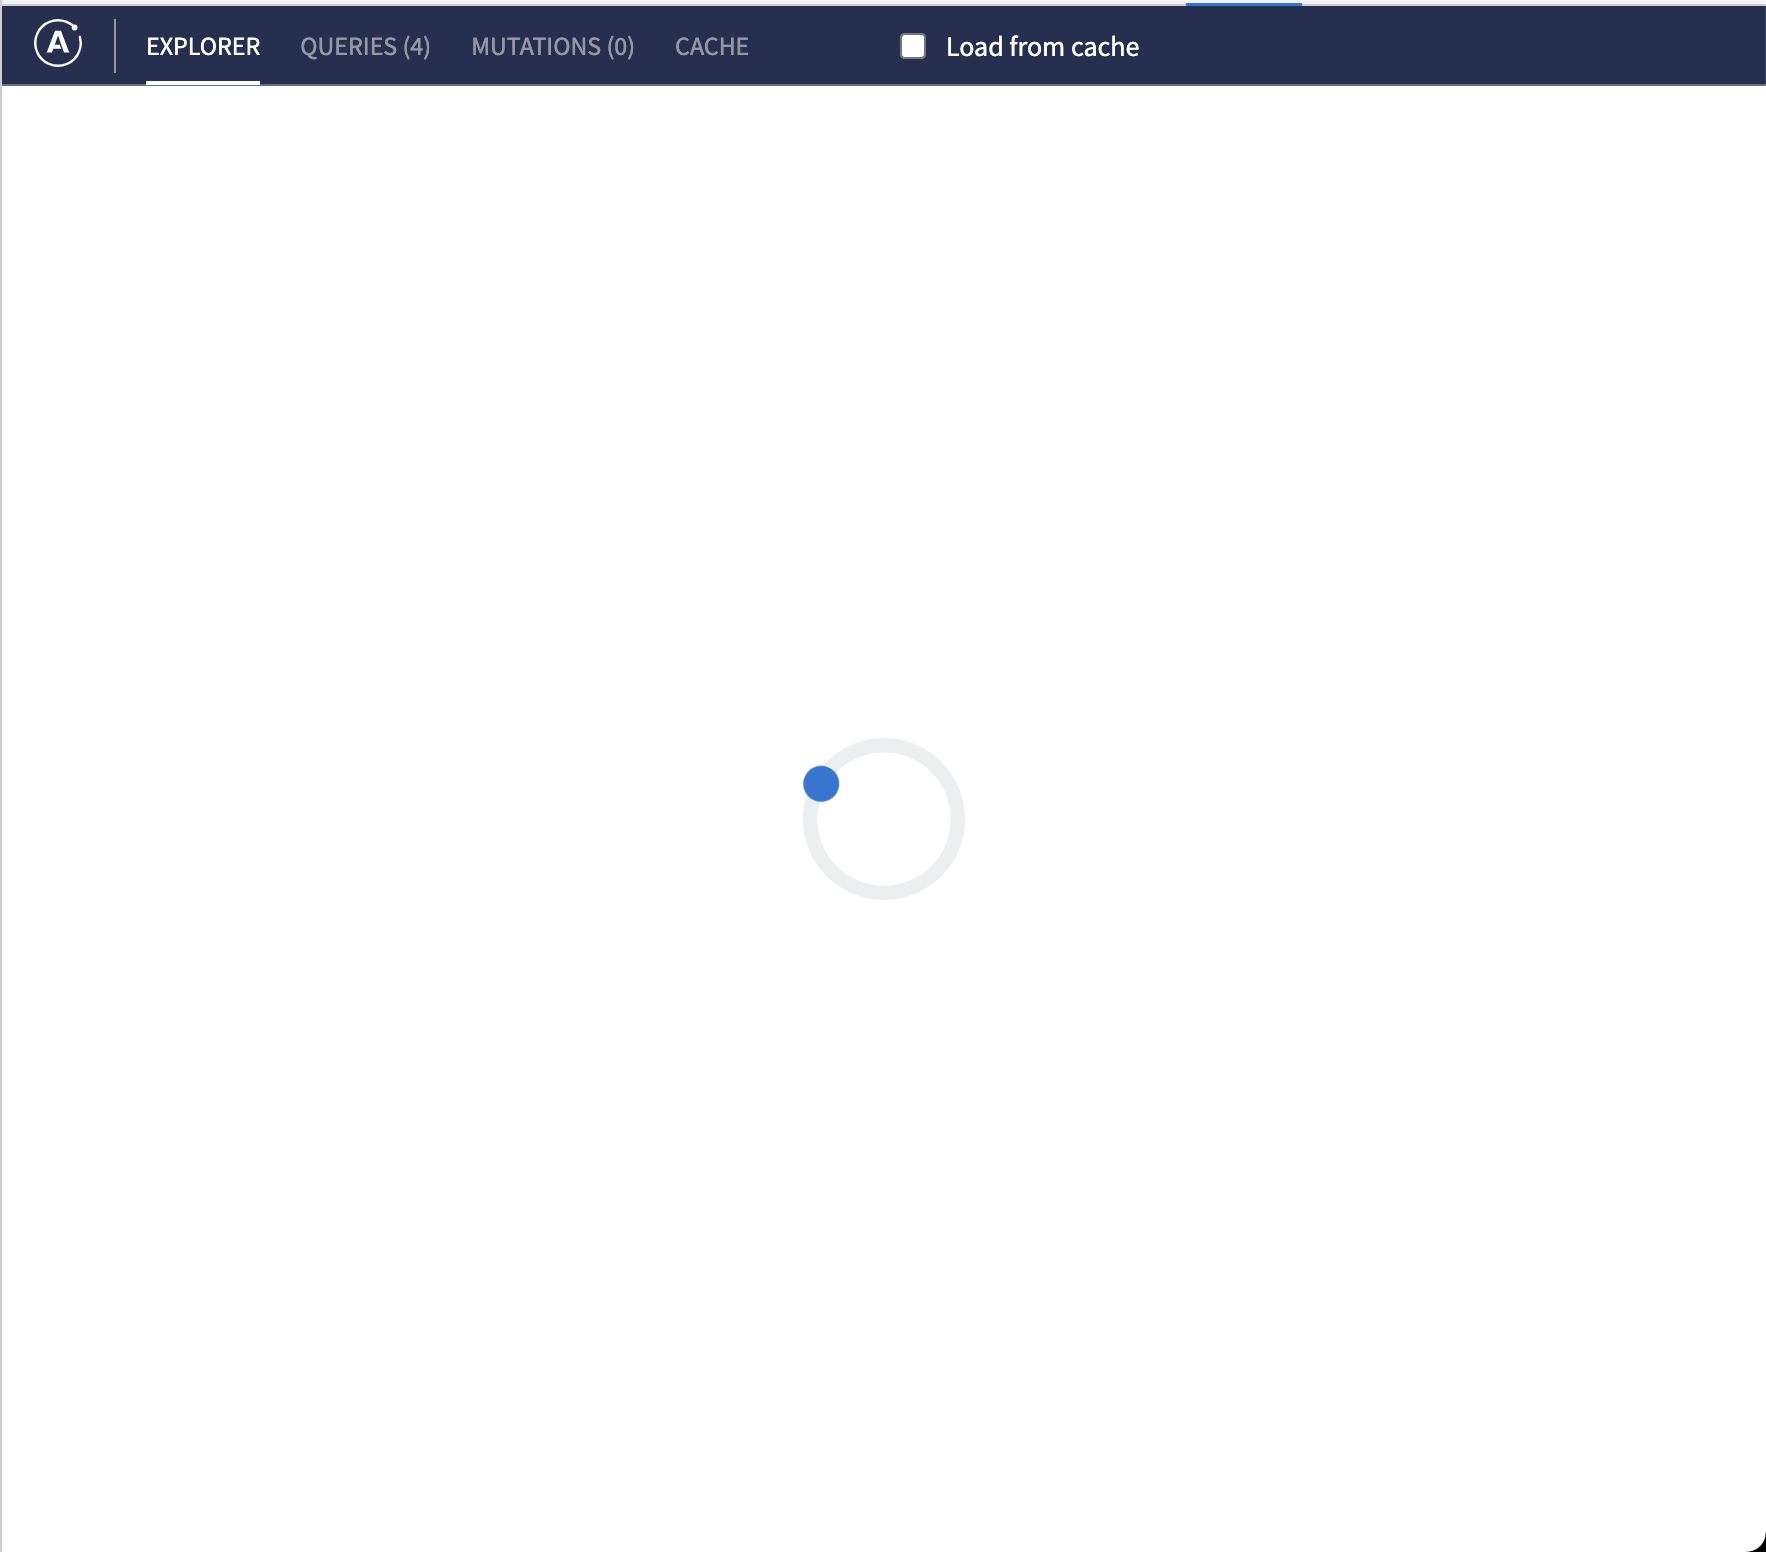
Same on my machine since several days ago. Apollo client devtools' explorer shows a loading spinner endlessly not only on my local graphql server but also on Space-X API and SWAPI. Queries/Mutations/Cache tabs seem to be ok, as they show intended contents such as active queries and cache content. The local graphql server log recorded accepting IntrospectionQuery from the client.
- OS: MacOS Catalina 10.15.7
- Browser: Firefox 99.0.1, Chrome 100.0.4896.127
- Apollo client devtools: 4.0.0
Same here with:
- OS: MacOS Big Sur 11.4
- Browser: Brave V1.38.109
- Apollo client devtools: 4.0.0
Since its a huge blocker on my end, I had to find a temporary fix: I installed the old version 3.0.5 and the explorer works with 3.0.5....
Same problem here, as a temp fix I downloaded the source code from the releases page (https://github.com/apollographql/apollo-client-devtools/releases/tag/v4.0.0) the version there is a bit older and seems to work fine, even though the current extension's version is also 4.0.0 🤷
It can be built with npm and node v10 (at least that's what I had to use to get it to work) -> the process here will get your explorer working in no time:
- download source from releases page, cd into it -> then run
npm install - run
npm run zip - unpack the zip file for chrome (located the newly created dist folder)
- remove the apollo extension from chrome
- make sure dev mode for extensions is on, the click the [load from unpacked] button in the chrome extensions tab
- locate the unpacked folder from step 3
- explorer 4.0 is working again 🥳 👯
Here is a prebuilt version if you want to skip steps 1 & 2: chrome-apollo_client_devtools-4.0.0.zip
I believe this was caused by a release that contained a bug with a missing handshake
It's since been fixed, but possibly persists on old bundles
Could you please try uninstalling and reinstalling the extension and clearing cache? 🙏
I was having this issue today. Removing the Apollo Dev Tools extension from Chrome then adding it back in fixed it for me.
We've decided to close this out as a re-installation seems to be the path to resolution.