Rolling mean on resampled data produces incorrect graph
I cannot correctly graph a rolling average on resampled data.
How to reproduce the bug
- Add this CSV file as a dataset: demo.csv
- Create a "Time-series Line Chart" based on the dataset provided
- Set the metric to be "AVG(value)"
- At this stage, if you click "Update chart" you'll see a straight line (y=5). Note, for example, there is no value for 2000-01-03, as expected.
- Open "Advanced Analytics"
- From the resampling rules, select "1 calendar day frequency"
- From fill method, select "Zero imputation" (or "Sum values", they both give the same outcome)
- If you update the chart now, you will see many days with zero values. The line is no longer the simple y=5. This is as expected.
- Select "mean" from as the rolling window function.
- Set period and min periods to, say, 5.
- Update the chart
- Note that graph is not a smooth curve, but rather has values at y=5 and y=0:
Expected results
I expected to see a smooth curve, with values between zero and 5, similar to:

Actual results
We see values at y=5 and y=0, not the values that would be expected from a rolling mean on resampled data:

Environment
- browser type and version: Firefox 109.0.1
- superset version: 0.0.0-dev. I've also tried this on Superset 2.3
- python version: 3.8.13
Checklist
Make sure to follow these steps before submitting your issue - thank you!
- [ x ] I have checked the superset logs for python stacktraces and included it here as text if there are any.
- [ x ] I have reproduced the issue with at least the latest released version of superset.
- [ x ] I have checked the issue tracker for the same issue and I haven't found one similar.
Additional context
I'm using the apache/superset Docker images.
I re-encountered this problem again. Here's an indication of the size of the effect, with two graphs superimposed. In blue we have Superset's results and in red we have a plot of data manipulated directly using Pandas.
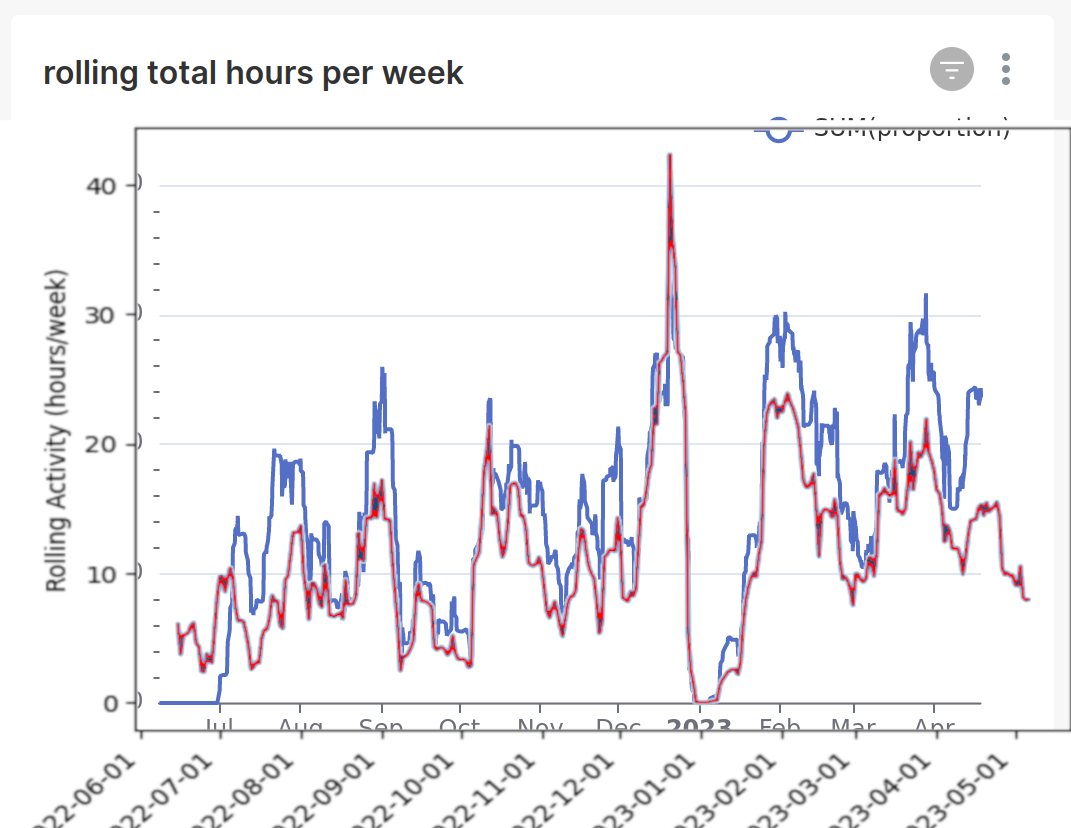
The difference is caused by the fact that we do not have data for weekends. These days are just ignored by Superset, but a correct manipulation would fill with zeros before calculating the rolling values.
This still seems to be an issue in 3.x. Thanks for giving sample data and a detailed repro flow. Keeping this open.
Still an issue in 4.0.1. I think the issue can be reduced down to the fact that the the rolling values are calculated first, after which the interpolation is carried out.
I can't really think of scenarios when you would want this to be the order instead of first interpolating, so a change of default would imho be justified.
This has been silent for nearly a year, but I'll leave it open since it's a data correctness issue. Volunteers welcome to contribute though, since this doesn't seem to be getting much interest or prioritization.