query with condition comparing with zero got incorrect results
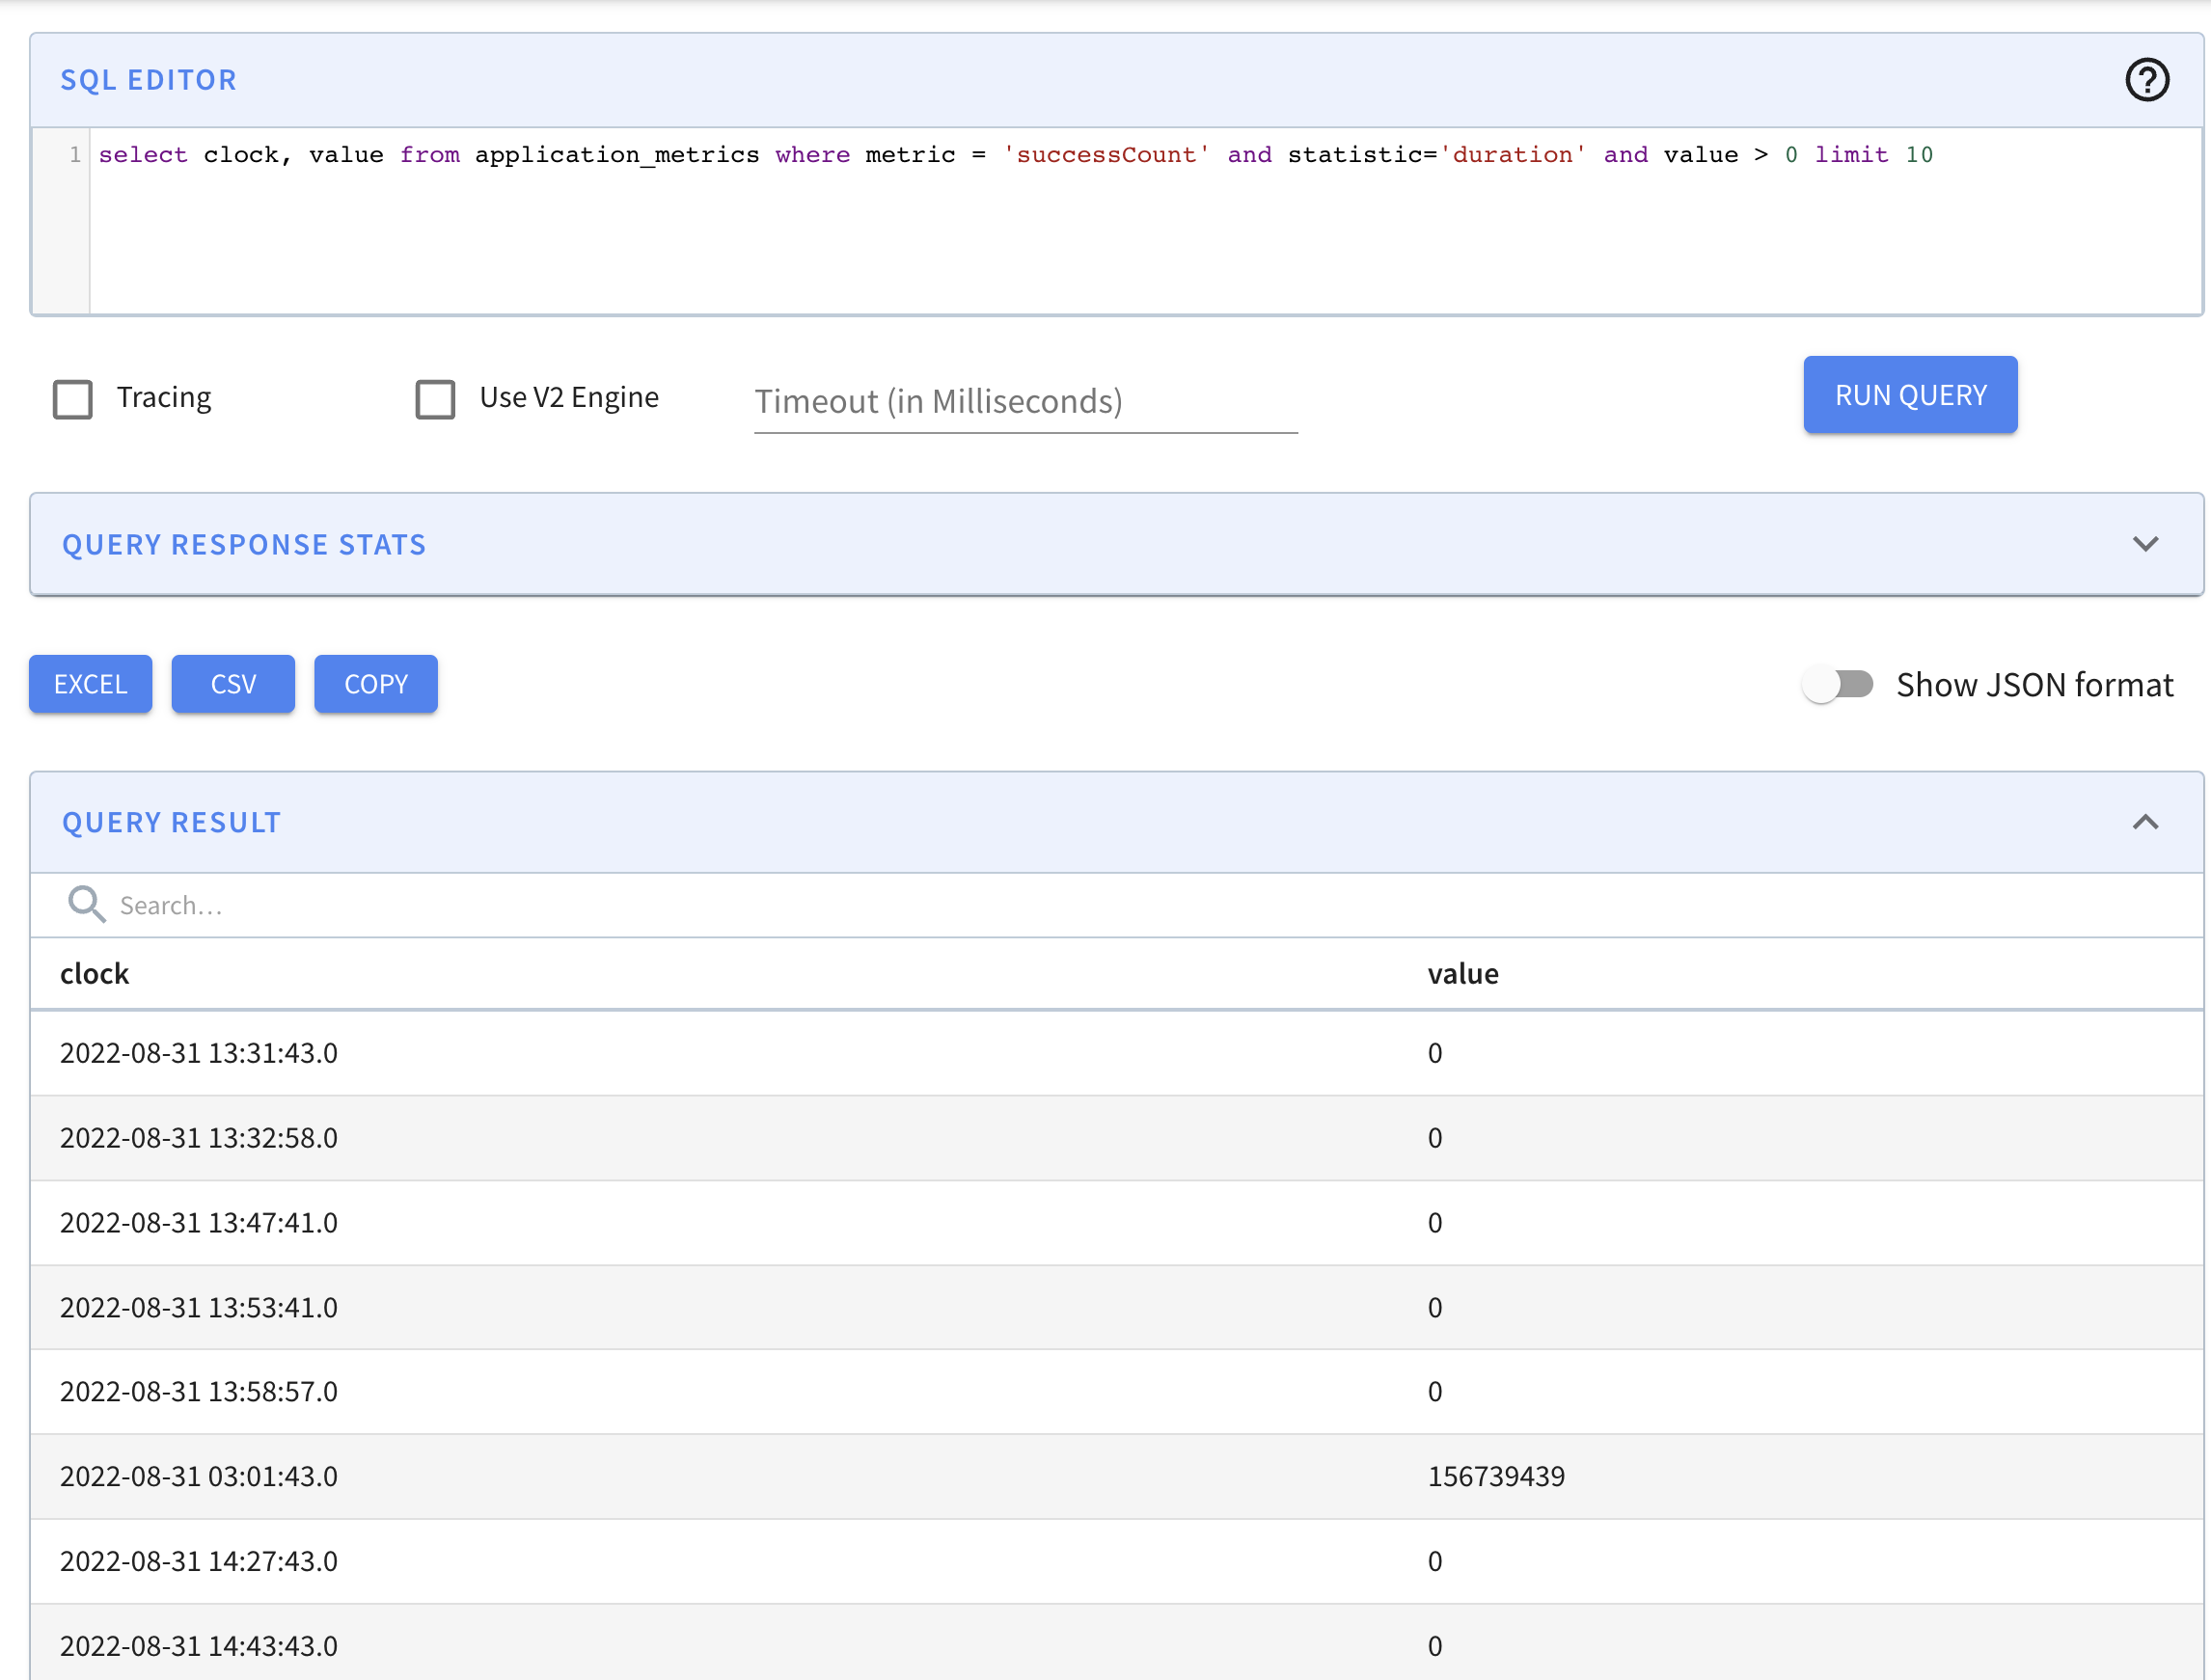
Hi, pinot team, when I ran a query with condition value > 0 but got results with value = 0
Is this an issue or should I make some special configuration to avoid this?
The query is:
select clock, value from application_metrics where metric = 'successCount' and statistic='duration' and value > 0 limit 10
clock is a time column with TIMESTAMP type and value is a metric column with DOUBLE type, the others are dimension columns. The pinot version is 0.11.0-SNAPSHOT and built form source with last commit hash 561e471a86278e0e486cd9e602f8499fc8f8517c
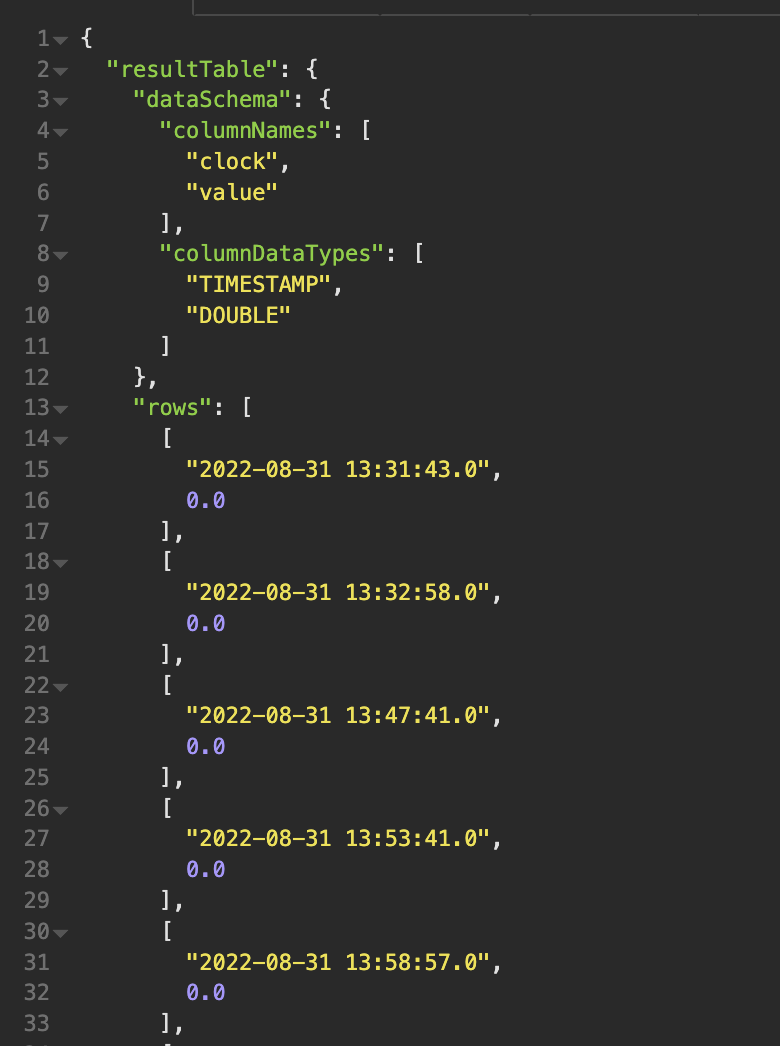
I also ran this query with the broker query api, and also got the wrong results.
Screenshots from the pinot UI and rest api tool are attached.
Thanks for reporting the issue. Can you please also share the table config for this table?
I can take a look at this. @huang1st please share the table config, or just what indexes you have on the value field, and whether it has a dictionary or not.
Sorry for the late reply. The table config is attached. application_metrics_tableconfig.txt
The star tree index is enabled for most of the columns.
And according to my observation, the issue only occurs in some specific filter conditions, I believe it only happens when the values of the value column are very scattered, such as 0, 107047240, 88962459.
Thank you very much!
Sorry for the late reply. The table config is attached. application_metrics_tableconfig.txt The star tree index is enabled for most of the columns. And according to my observation, the issue only occurs in some specific filter conditions, I believe it only happens when the values of the
valuecolumn are very scattered, such as 0, 107047240, 88962459. Thank you very much!
Thanks, can you also provide the output when you prefix your query with “explain plan for” please?
@richardstartin the query plan is below:
| Operator | Operator_Id | Parent_Id |
|---|---|---|
| BROKER_REDUCE(limit:10) | 1 | 0 |
| COMBINE_SELECT | 2 | |
| PLAN_START(numSegmentsForThisPlan:1395) | -1 | -1 |
| SELECT(selectList:clock, value) | 3 | 2 |
| TRANSFORM_PASSTHROUGH(clock, value) | 4 | 3 |
| PROJECT(value, clock) | 5 | 4 |
| DOC_ID_SET | 6 | 5 |
| FILTER_AND | 7 | 6 |
| FILTER_FULL_SCAN(operator:EQ,predicate:metric = 'successCount') | 8 | 7 |
| FILTER_FULL_SCAN(operator:EQ,predicate:statistic = 'duration') | 9 | 7 |
| ILTER_FULL_SCAN(operator:RANGE,predicate:value > '0.0') | 10 | 7 |
Is metric a metric column or a text column?
            "name": "metric",
            "encodingType": "RAW",
            "indexType": "TEXT",
            "indexTypes": [
                "TEXT"
            ]```
Is
metrica metric column or a text column?"name": "metric", "encodingType": "RAW", "indexType": "TEXT", "indexTypes": [ "TEXT" ]```
It is a dimension column and the type is string. I have attached the schema, you can have a look. application_metrics_schema.txt
@huang1st Sorry I lost track of this issue. Did you find the cause of the issue?
Is the value column always whole number in the input data? What is the rough cardinality (unique values) of the column?
Most likely the issue is caused by #8722, but I don't see why it doesn't work. If you can reproduce it, can you try reverting this commit and see if the issue is fixed?
@Jackie-Jiang, sorry for the late reply. After upgrading the version to 0.11.0 release, this issue can't be reproduced again. I think it has been fixed in the release version.