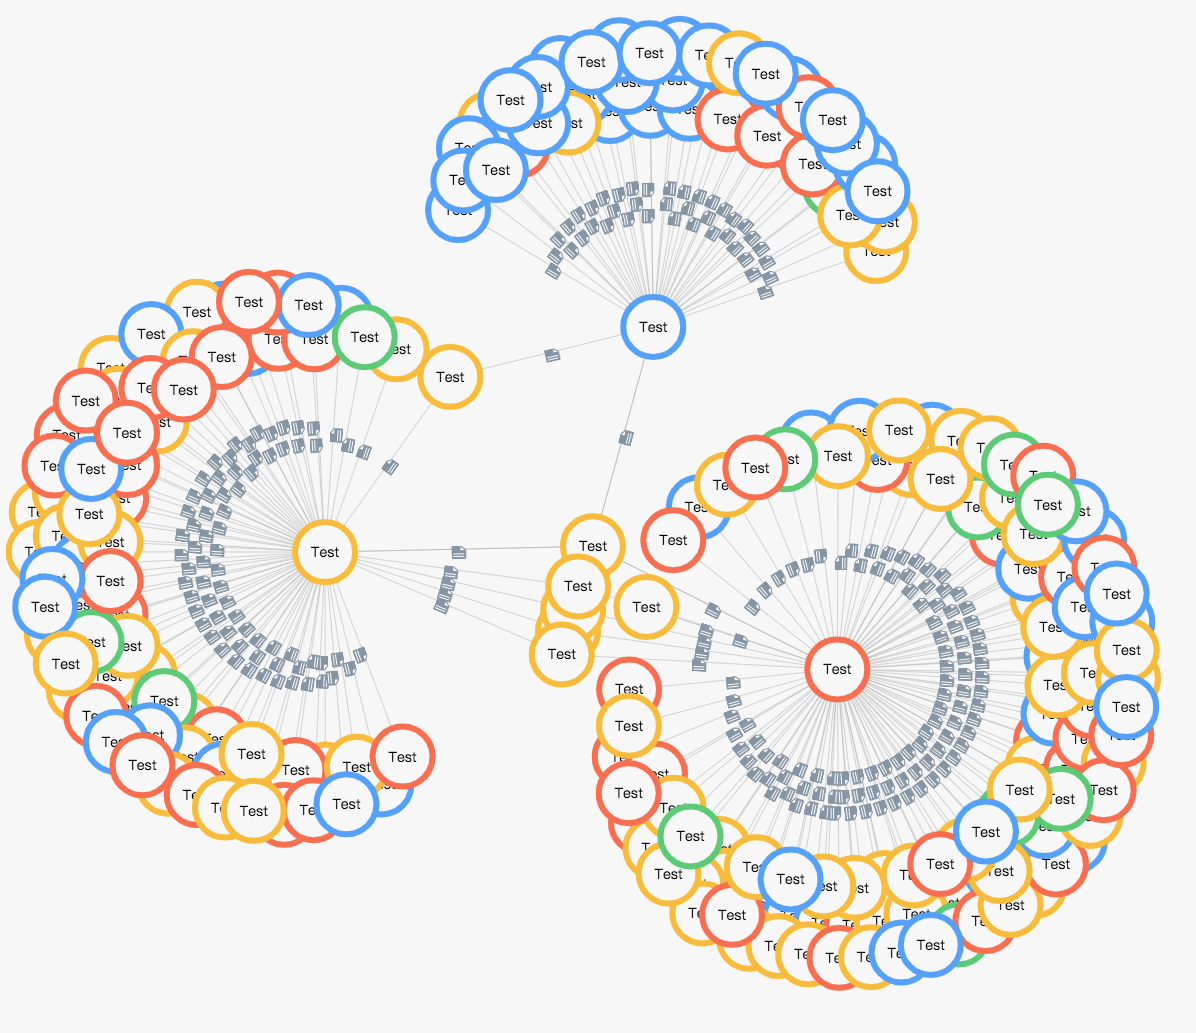
关于force图表相关问题
- 节点重叠,过多节点时节点重叠。
- 节点拖拽,能否将节点位置定位到拖拽后位置,不弹回去。
- 缩放问题,能否缩放时相应label字体大小也缩放.
- edgeLabel 上的图标能否不旋转
options = {
    backgroundColor: '#f7f7f7',
    tooltip: {
      formatter: function (param) {
        if (param.dataType === 'edge') {  // 线
          // return param.value;
        } else // 点
          return param.data.name;
      }
    },
    series: [
      {
        symbol: 'circle', // path://
        type: 'graph',
        layout: 'force', // circular ,force
        animation: false,
        hoverAnimation:true,
        animationDurationUpdate: 100,
        animationEasingUpdate: 'quinticInOut',
        // focusNodeAdjacency: true,
        // legendHoverLink: true,
        repulsion: 1000,
        useUTC: false,
        symbolSize: 60,
        roam: true,
        draggable: true,
        nodeScaleRatio: 1,
        scaleLimit: {
          min:0.8,
          max: 2,
        },
        label: {
          normal: {
            show: true,
            fontSize: 14,
            fontWeight: 400,
            color: '#000',
            formatter:function(nodes){
              return nodes.data.name.substring(0,6)
            }
          },
        },
        itemStyle:{
          // shadowColor: 'rgba(34,0,74,0.50)',
          // shadowBlur: 10,
          // boxShadow:'inset 0 0 37px 0 rgba(34,0,74,0.50)',
          color:'#f7f7f7',
          borderWidth:6,
        },
        force: {
          repulsion: 55,
          gravity: 0.01,
          edgeLength: 200
        },
        edgeLabel: {
          padding: 5,
          normal: {
            show: true,
            verticalAlign: 'top',
            backgroundColor: {
              image: require('../../assets/images/file2.png'),
            },
            textStyle: {
              symbolKeepAspect: true,
              fontWeight: 200,
              fontSize: 16,
            },
            formatter: "{c}"
          },
        },
        lineStyle: {
          normal: {
            opacity: 1,
            width: .5,
            curveness: 0
          }
        }
      },
    ]
  }
- 目前拖拽是这样解决的 但是节点少的时候有点问题。
myChart.on('mouseup', params => {
      if (params.dataType === 'node') {
        let option = myChart.getOption();
        if (option.series[0].data.length > 1) {
          option.series[0].data[params.dataIndex].x = params.event.offsetX;
          option.series[0].data[params.dataIndex].y = params.event.offsetY;
          option.series[0].data[params.dataIndex].fixed = true;
          myChart.setOption(option);
        }
      }
});
我还有一个扩展的需求,就是在某点扩展出来跟他有关系的,目前的实现方案是setOption追加data,感觉这个不是最佳方案,因为setOption会重新绘图,节点的位置又都变了,我已经不知道在什么地方扩展的了。希望作者或者各位大佬帮忙解决下我的问题
Make node fixed after dragging (problem solved) #9488 https://github.com/apache/incubator-echarts/issues/9488
@Ovilia The problem about fixed node already sloved by @Clarkclk at #9488, just change 'setUnfixed=false' to 'setUnfixed=true' in echart.js
This issue has been automatically marked as stale because it did not have recent activity. It will be closed in 7 days if no further activity occurs. If you wish not to mark it as stale, please leave a comment in this issue.
This issue has been automatically closed because it did not have recent activity. If this remains to be a problem with the latest version of Apache ECharts, please open a new issue and link this to it. Thanks!