feat(funnel): add funnel new styles #14863
Brief Information
This pull request is in the type of:
- [ ] bug fixing
- [x] new feature
- [ ] others
What does this PR do?
- [x] Add a property to flatten the funnel exit based on the existing funnel style.
- [x] Add a dynamic height prop
Fixed issues
#14863 #16445 #17566
Details
Before: What was the problem?
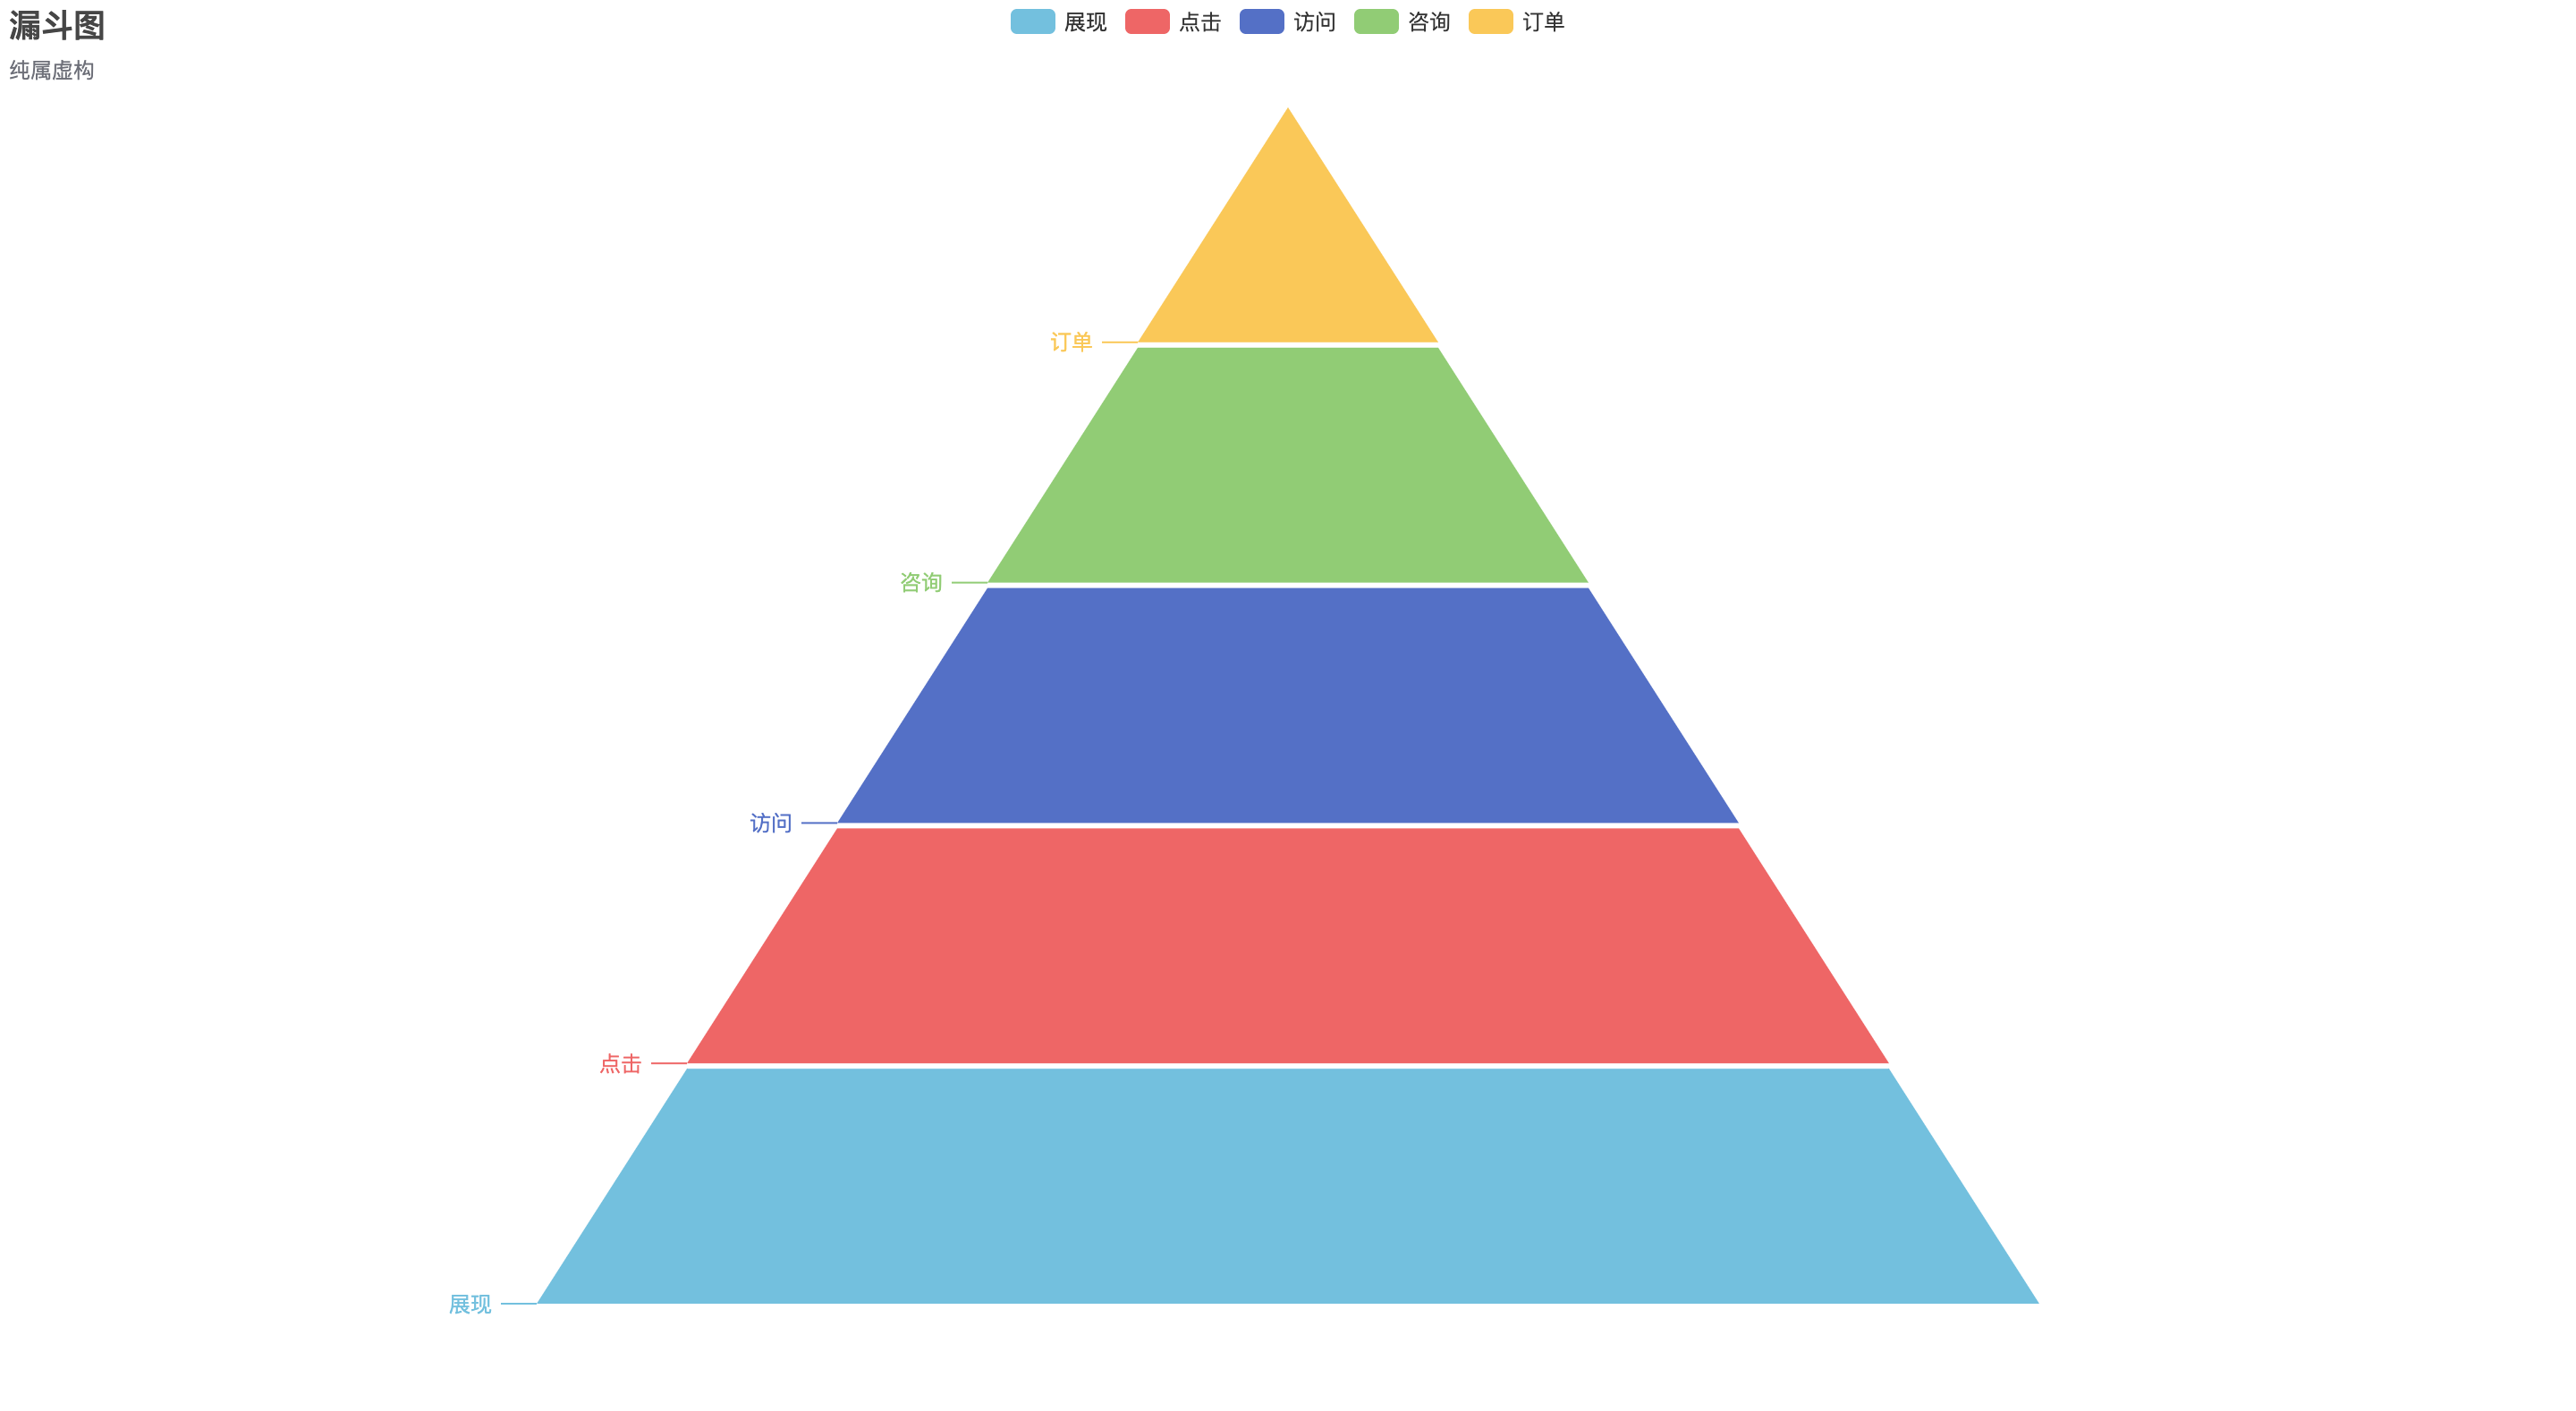
The following is the current style of funnel diagram, and you can see that there is a lot of room to expand the function of funnel diagram such as flatten the top and so on.
After: How does it behave after the fixing?
To preserve the original style, the new style needs to be set with new options.
- If you want to flatten the top to represent none zero value, please set
exitWidthas100%.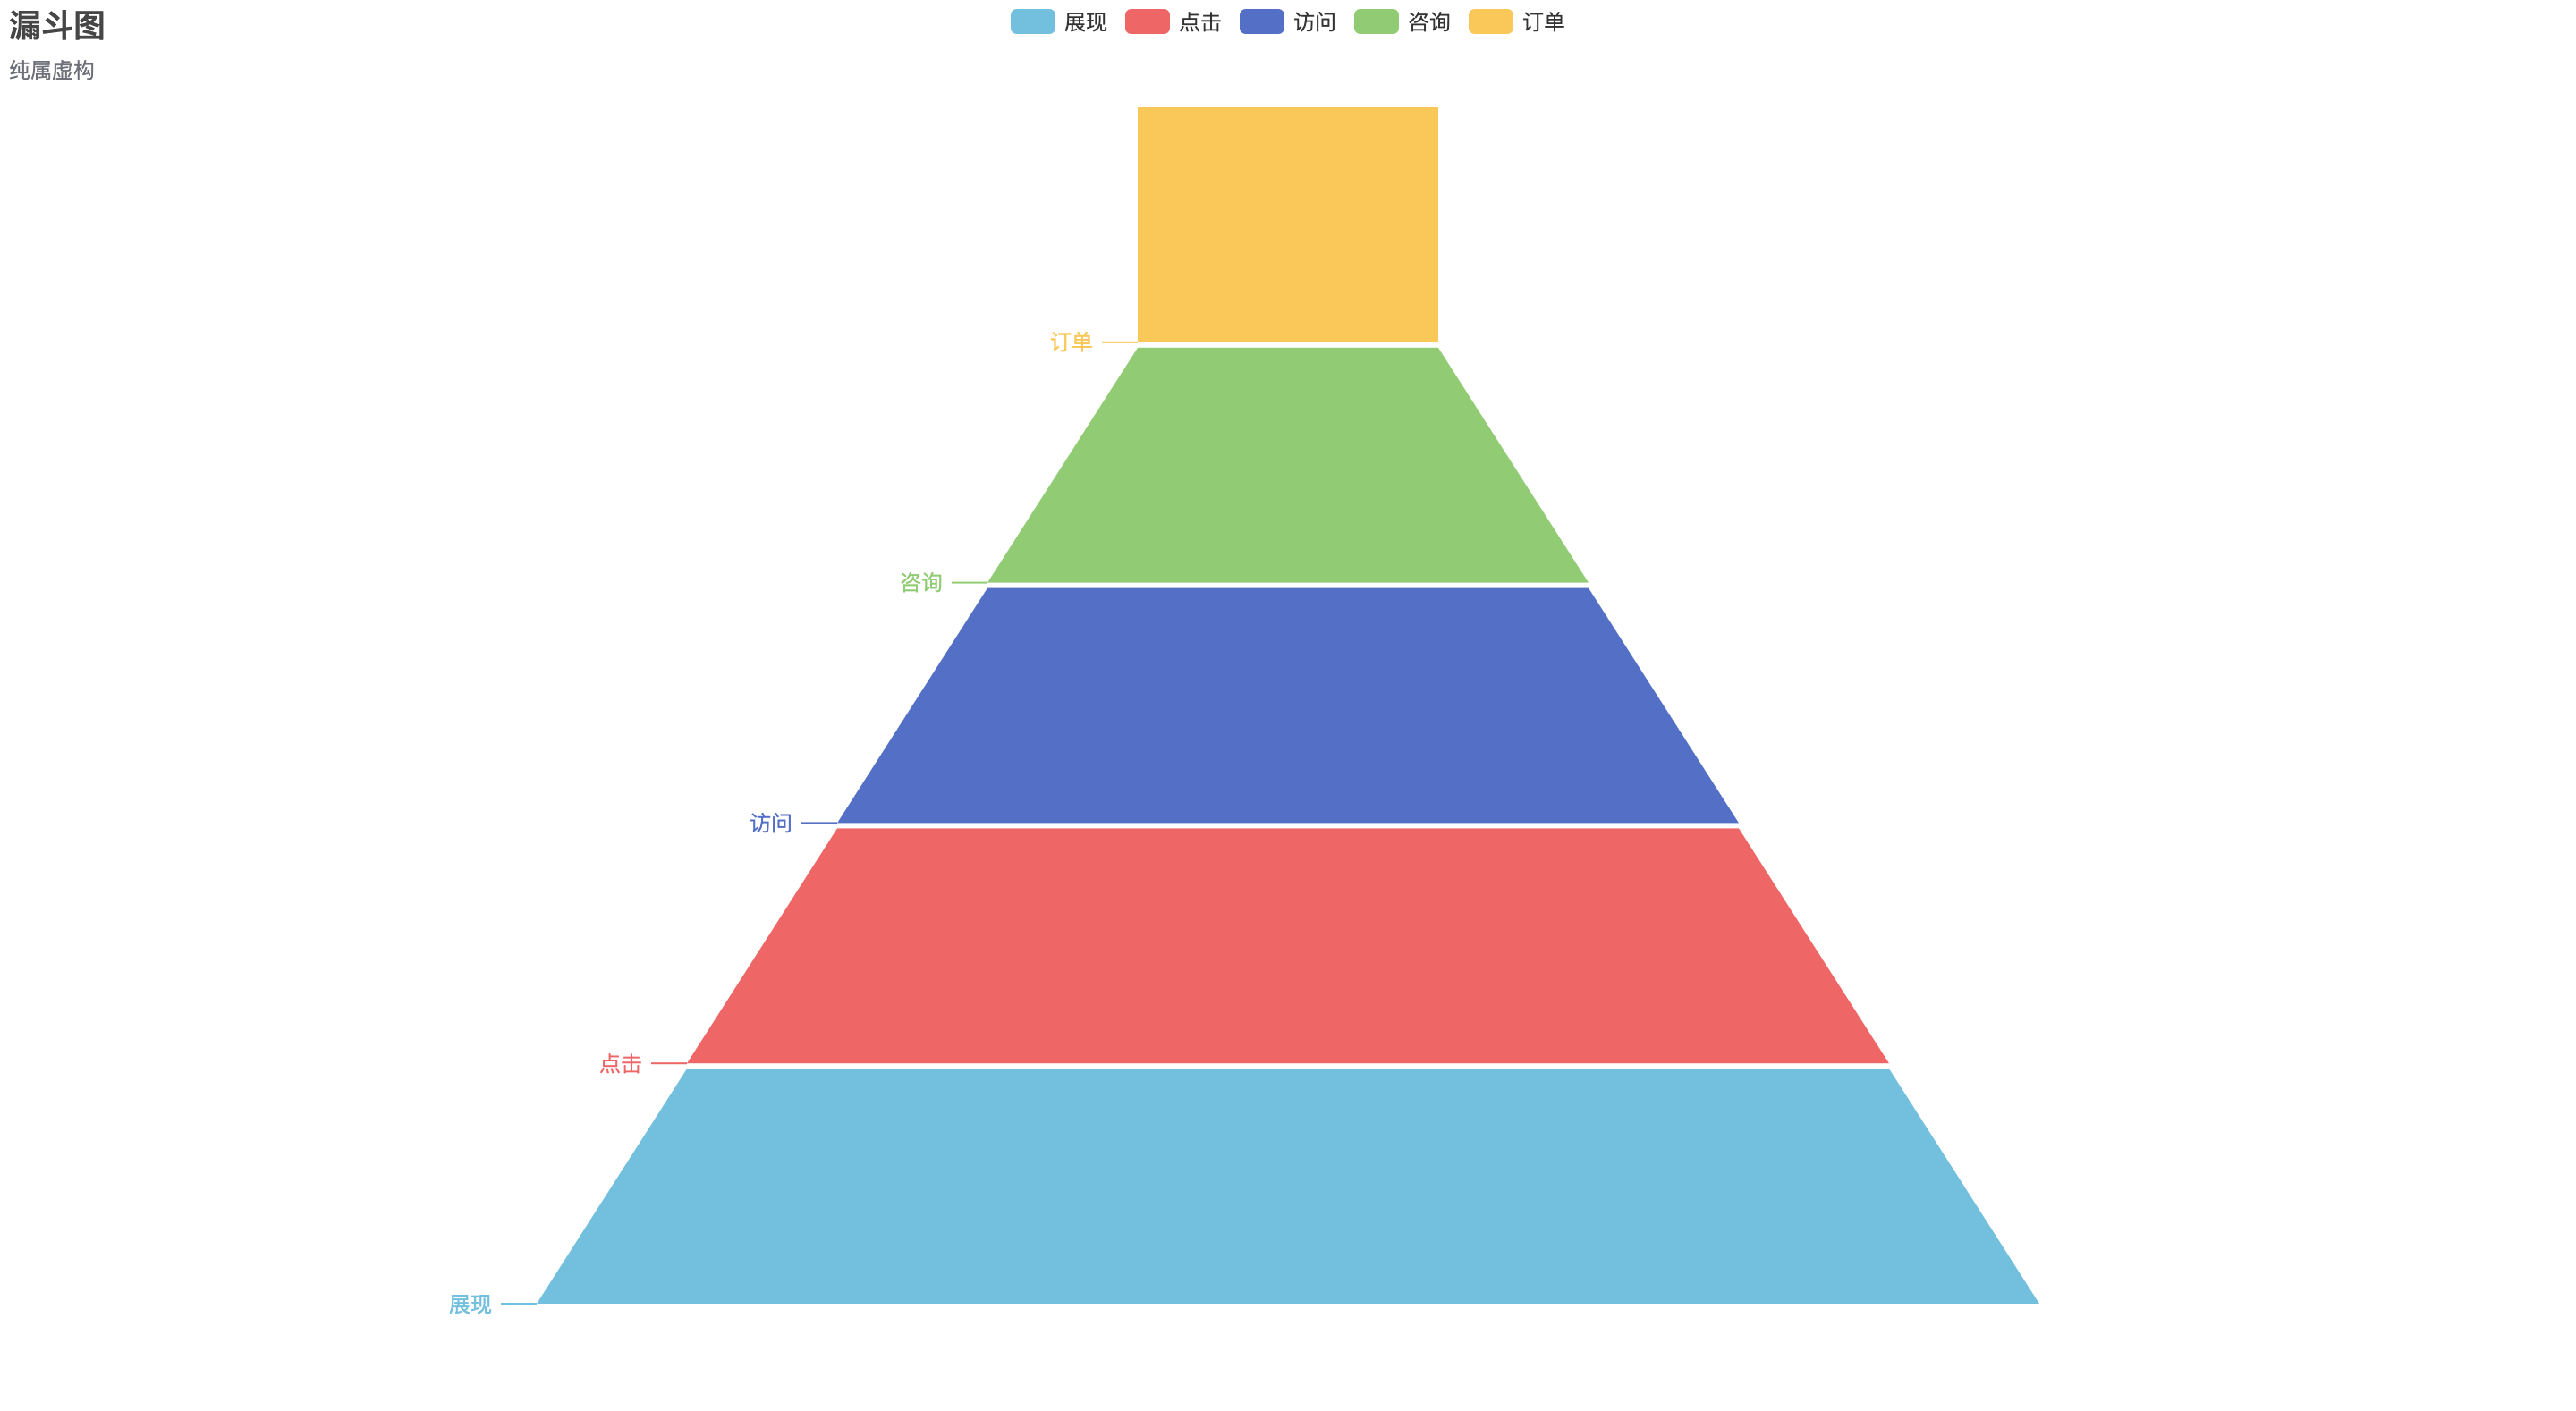
- If you want data dynamic mapping on the height, please set
dynamicHeightastrue.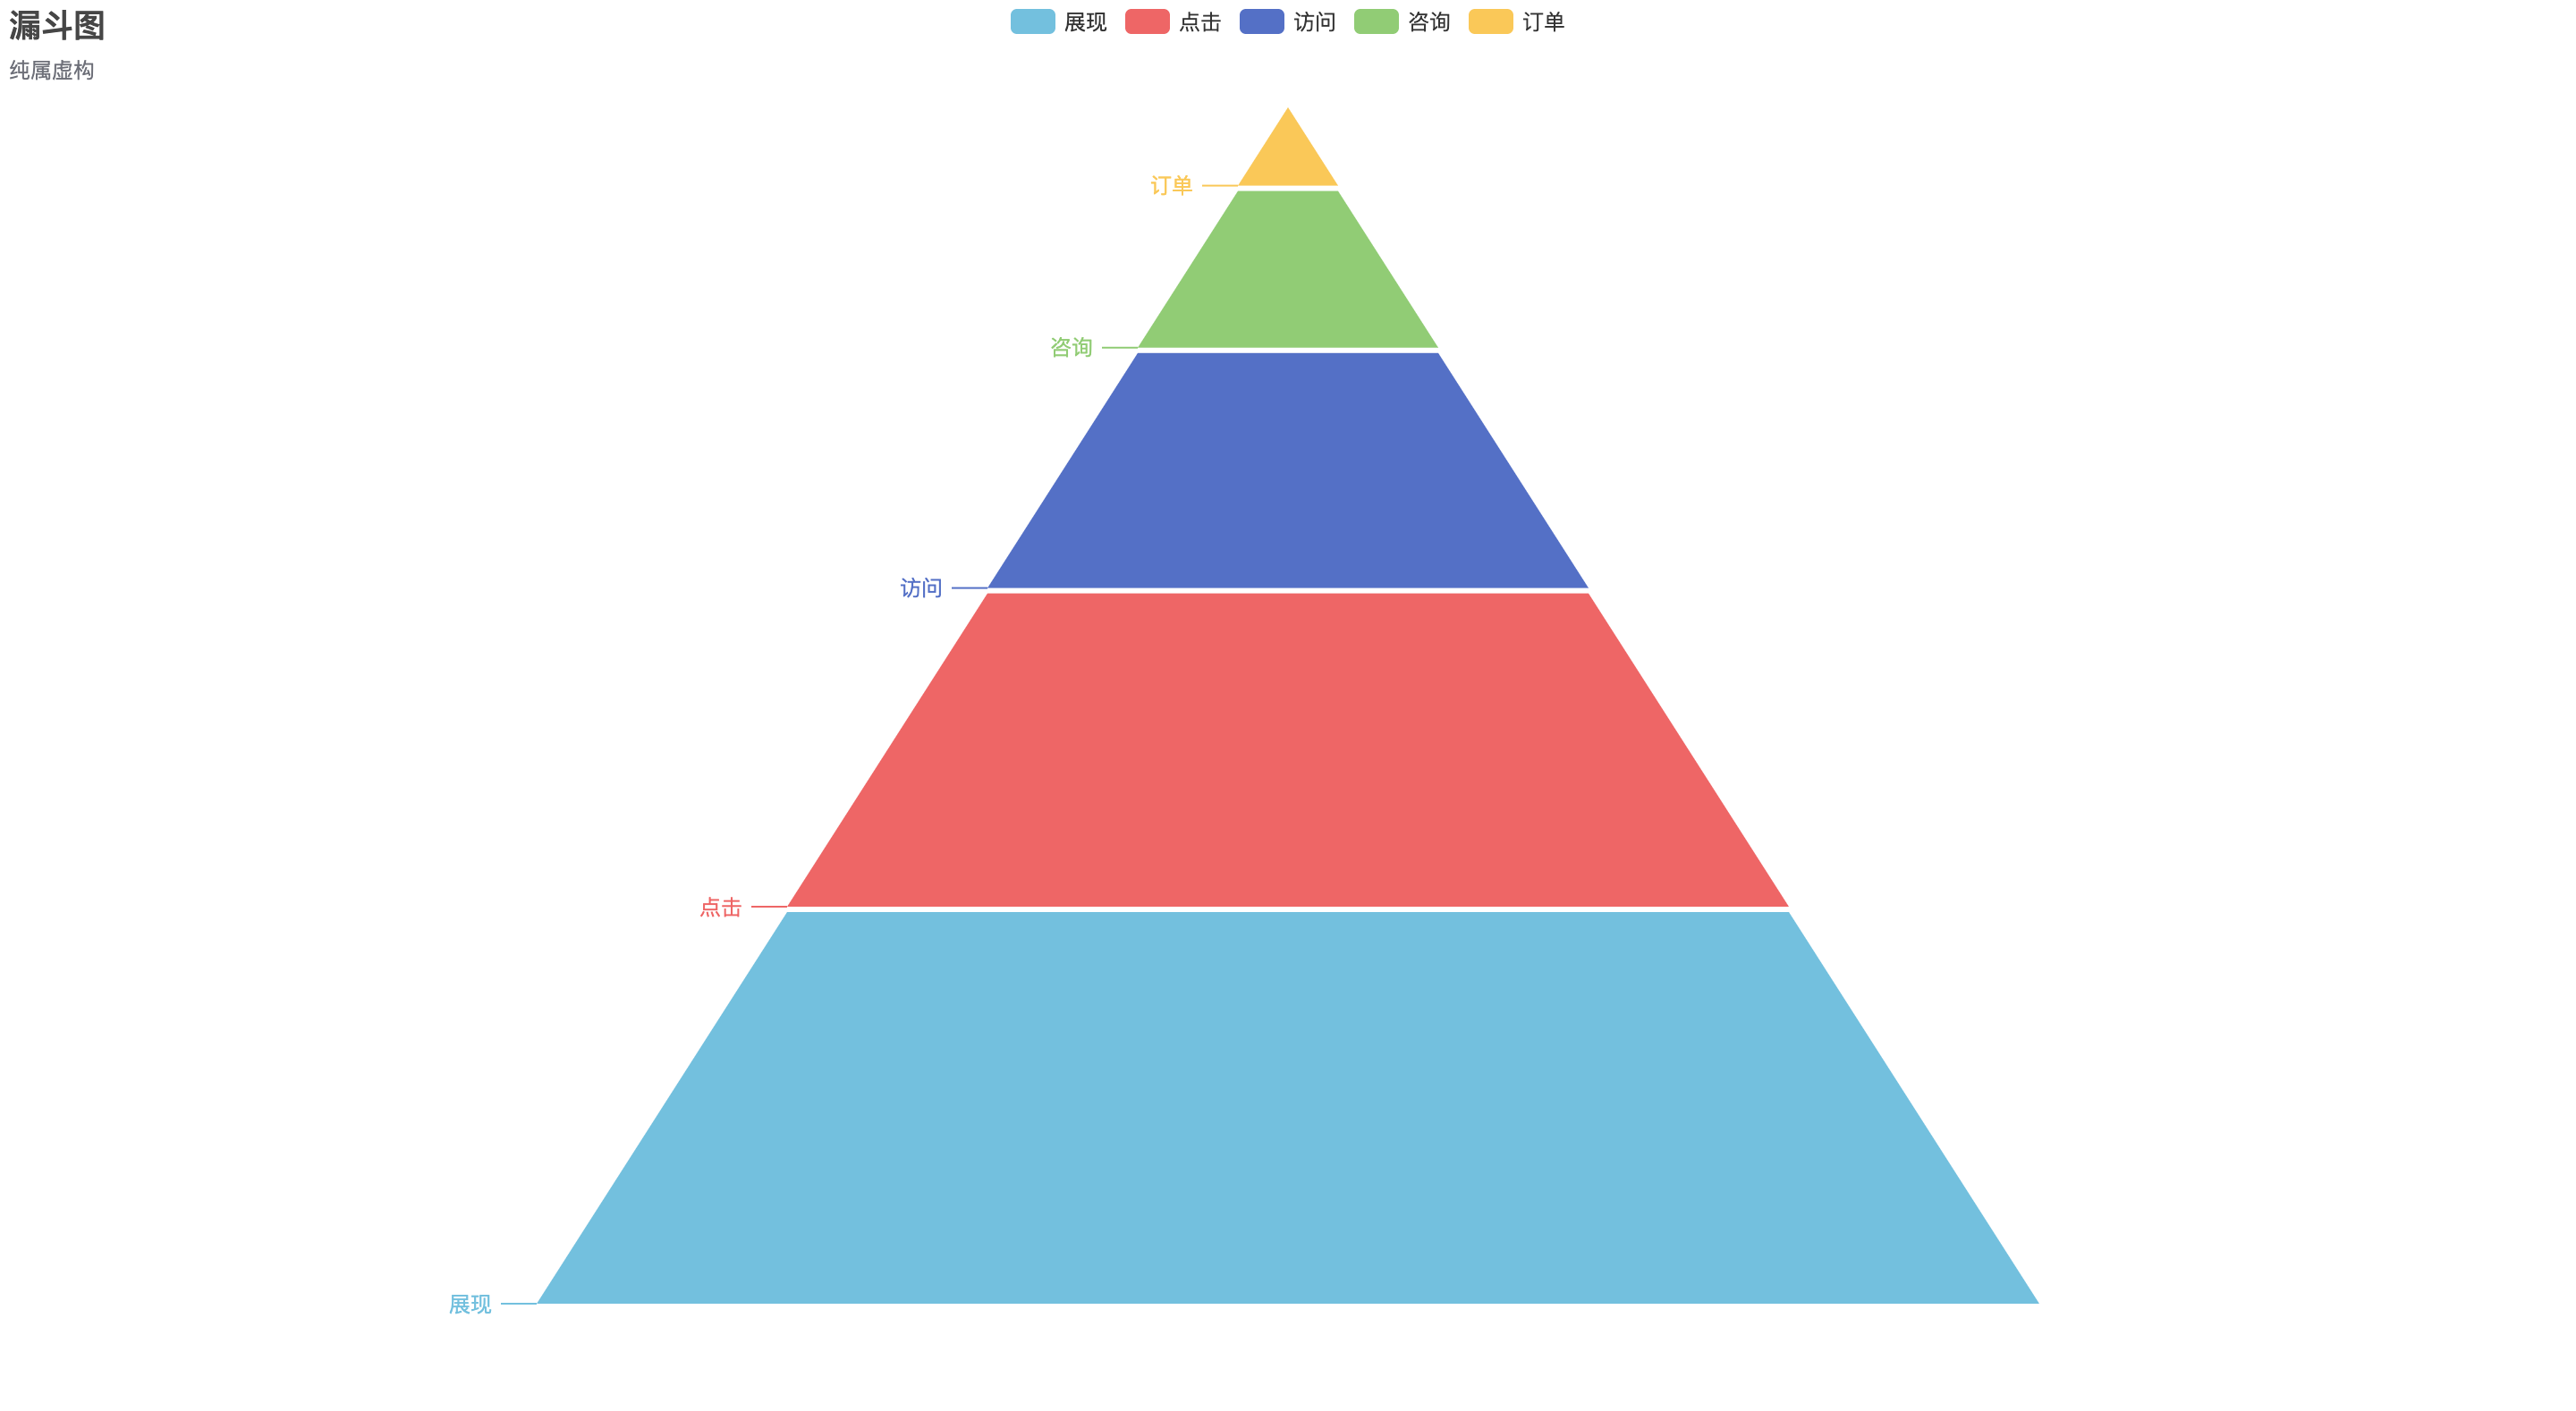 ## Document Info
 - If you want the previous funnel to be a little bit thicker, please set
thickDegreeas a percentage string between 0% and 100% such as'33%'.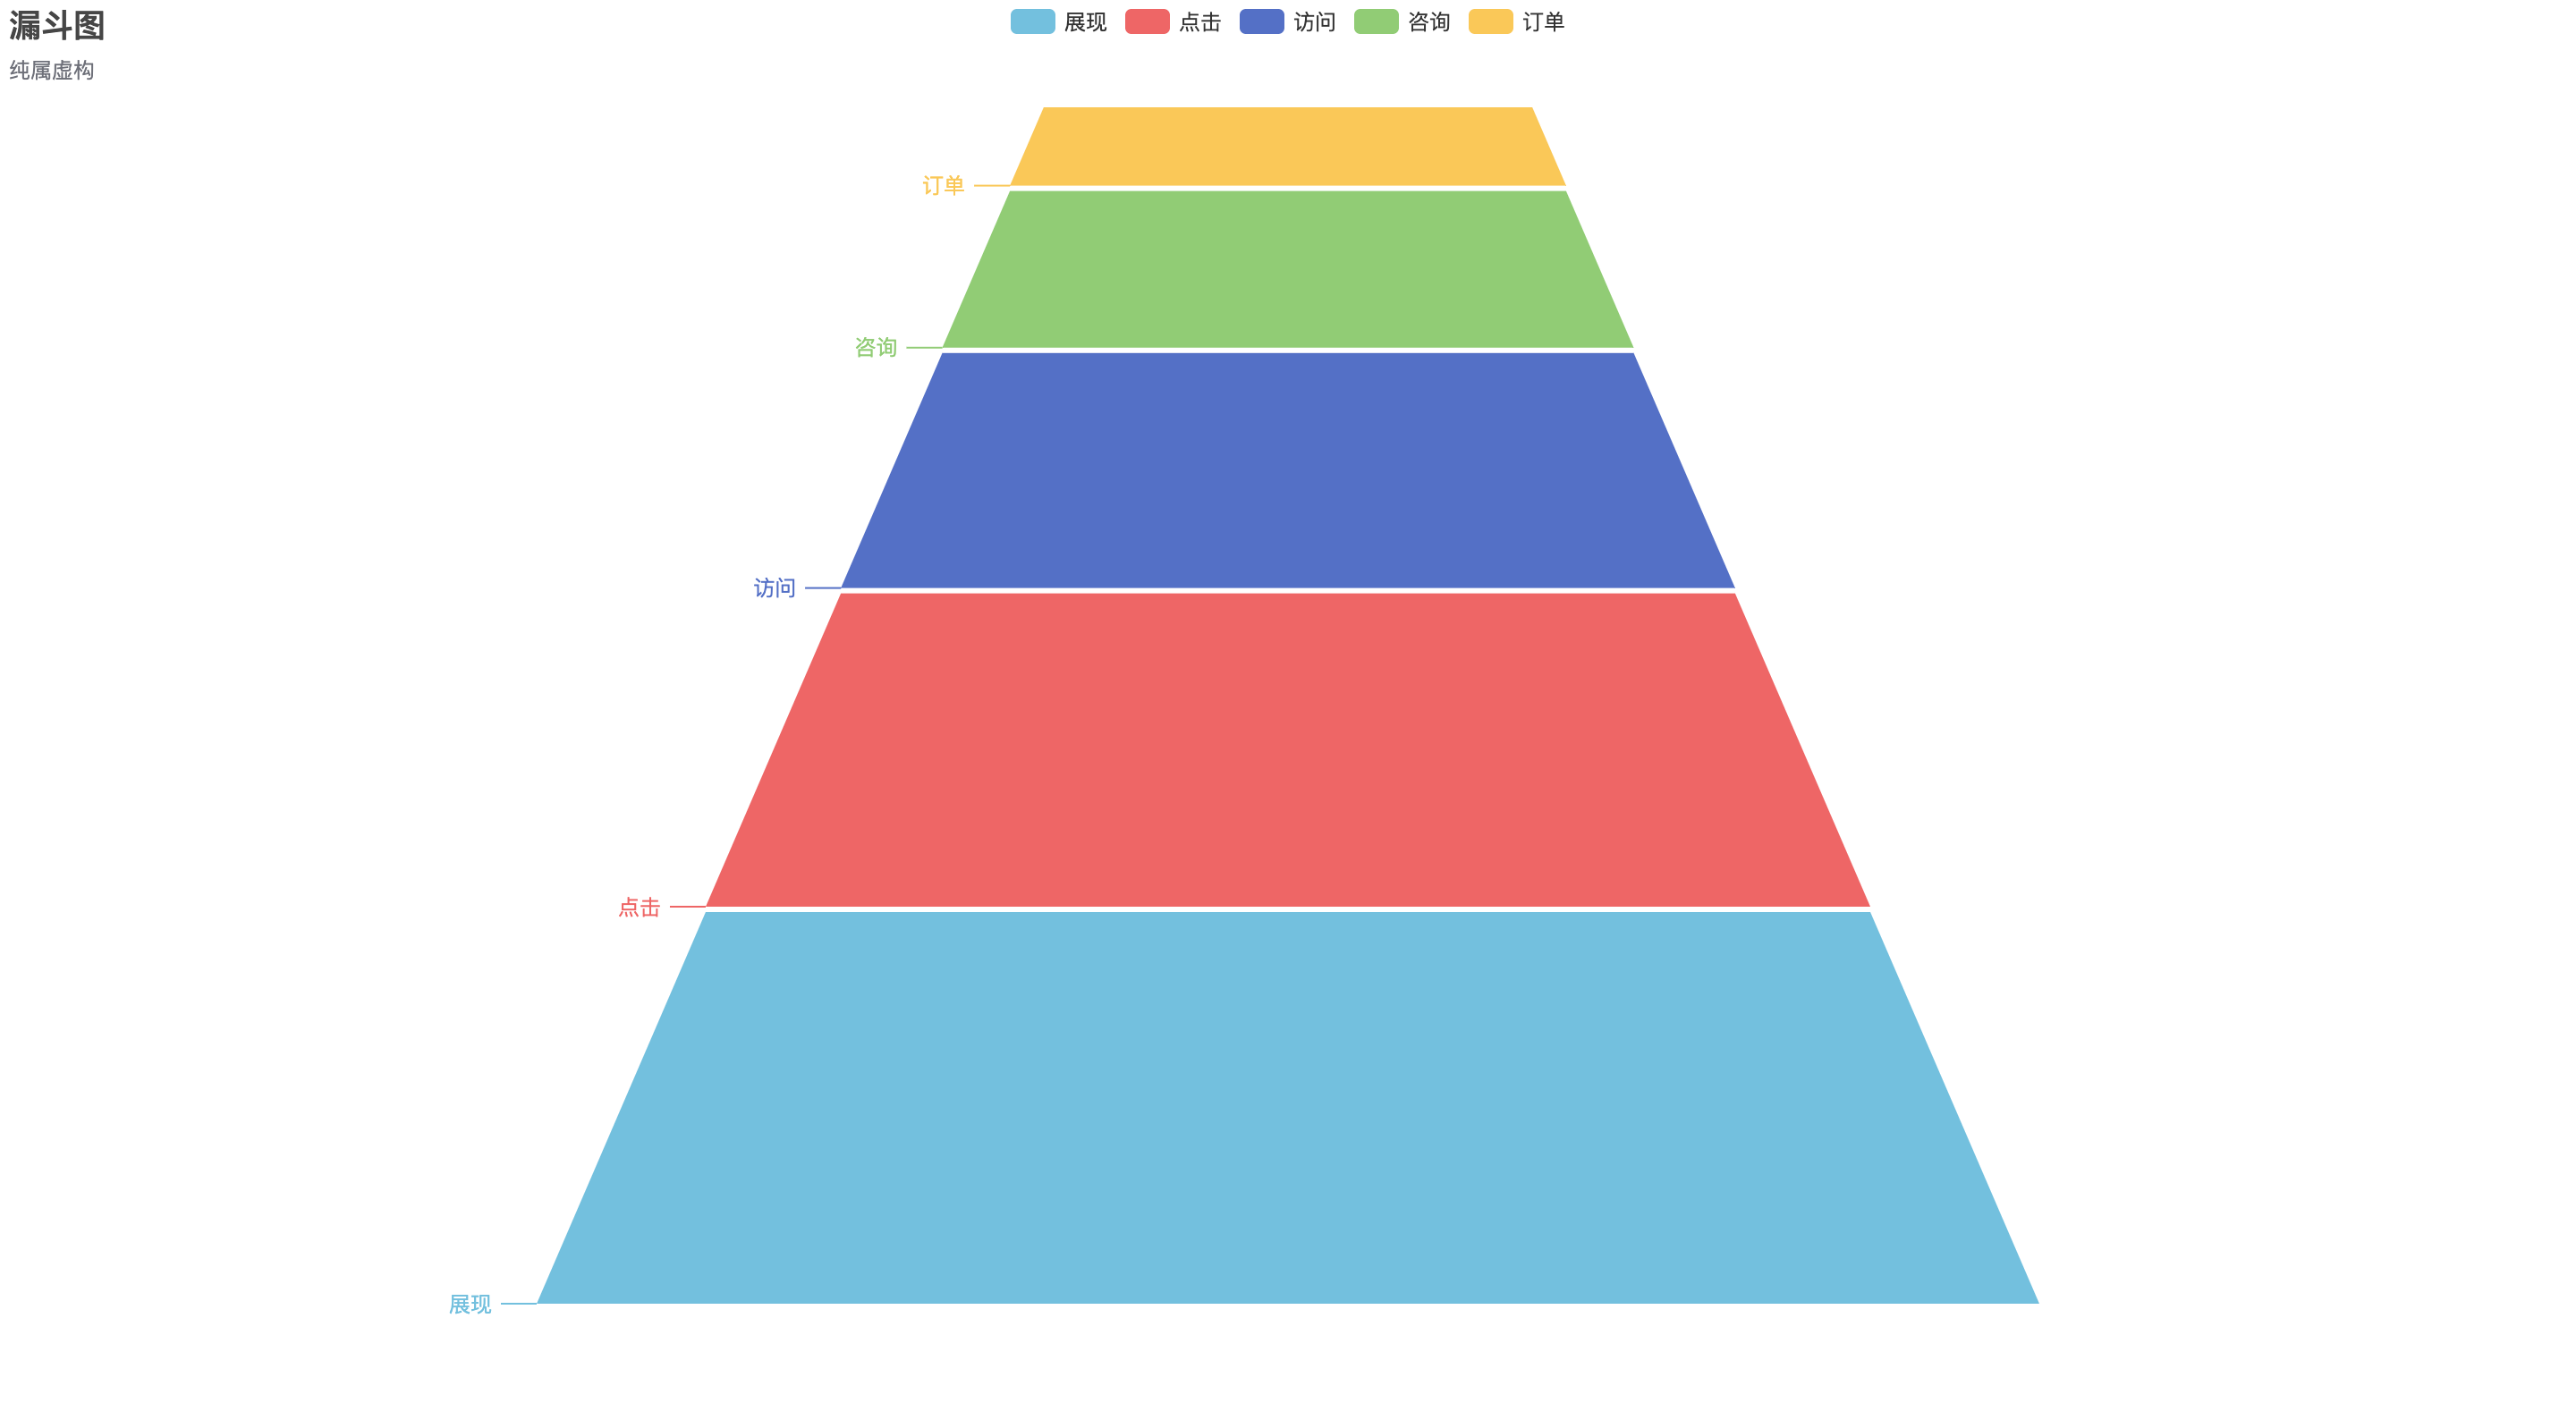
- If you want to show the conversion rate between each of the data in Figure 1, please set
showRateas true.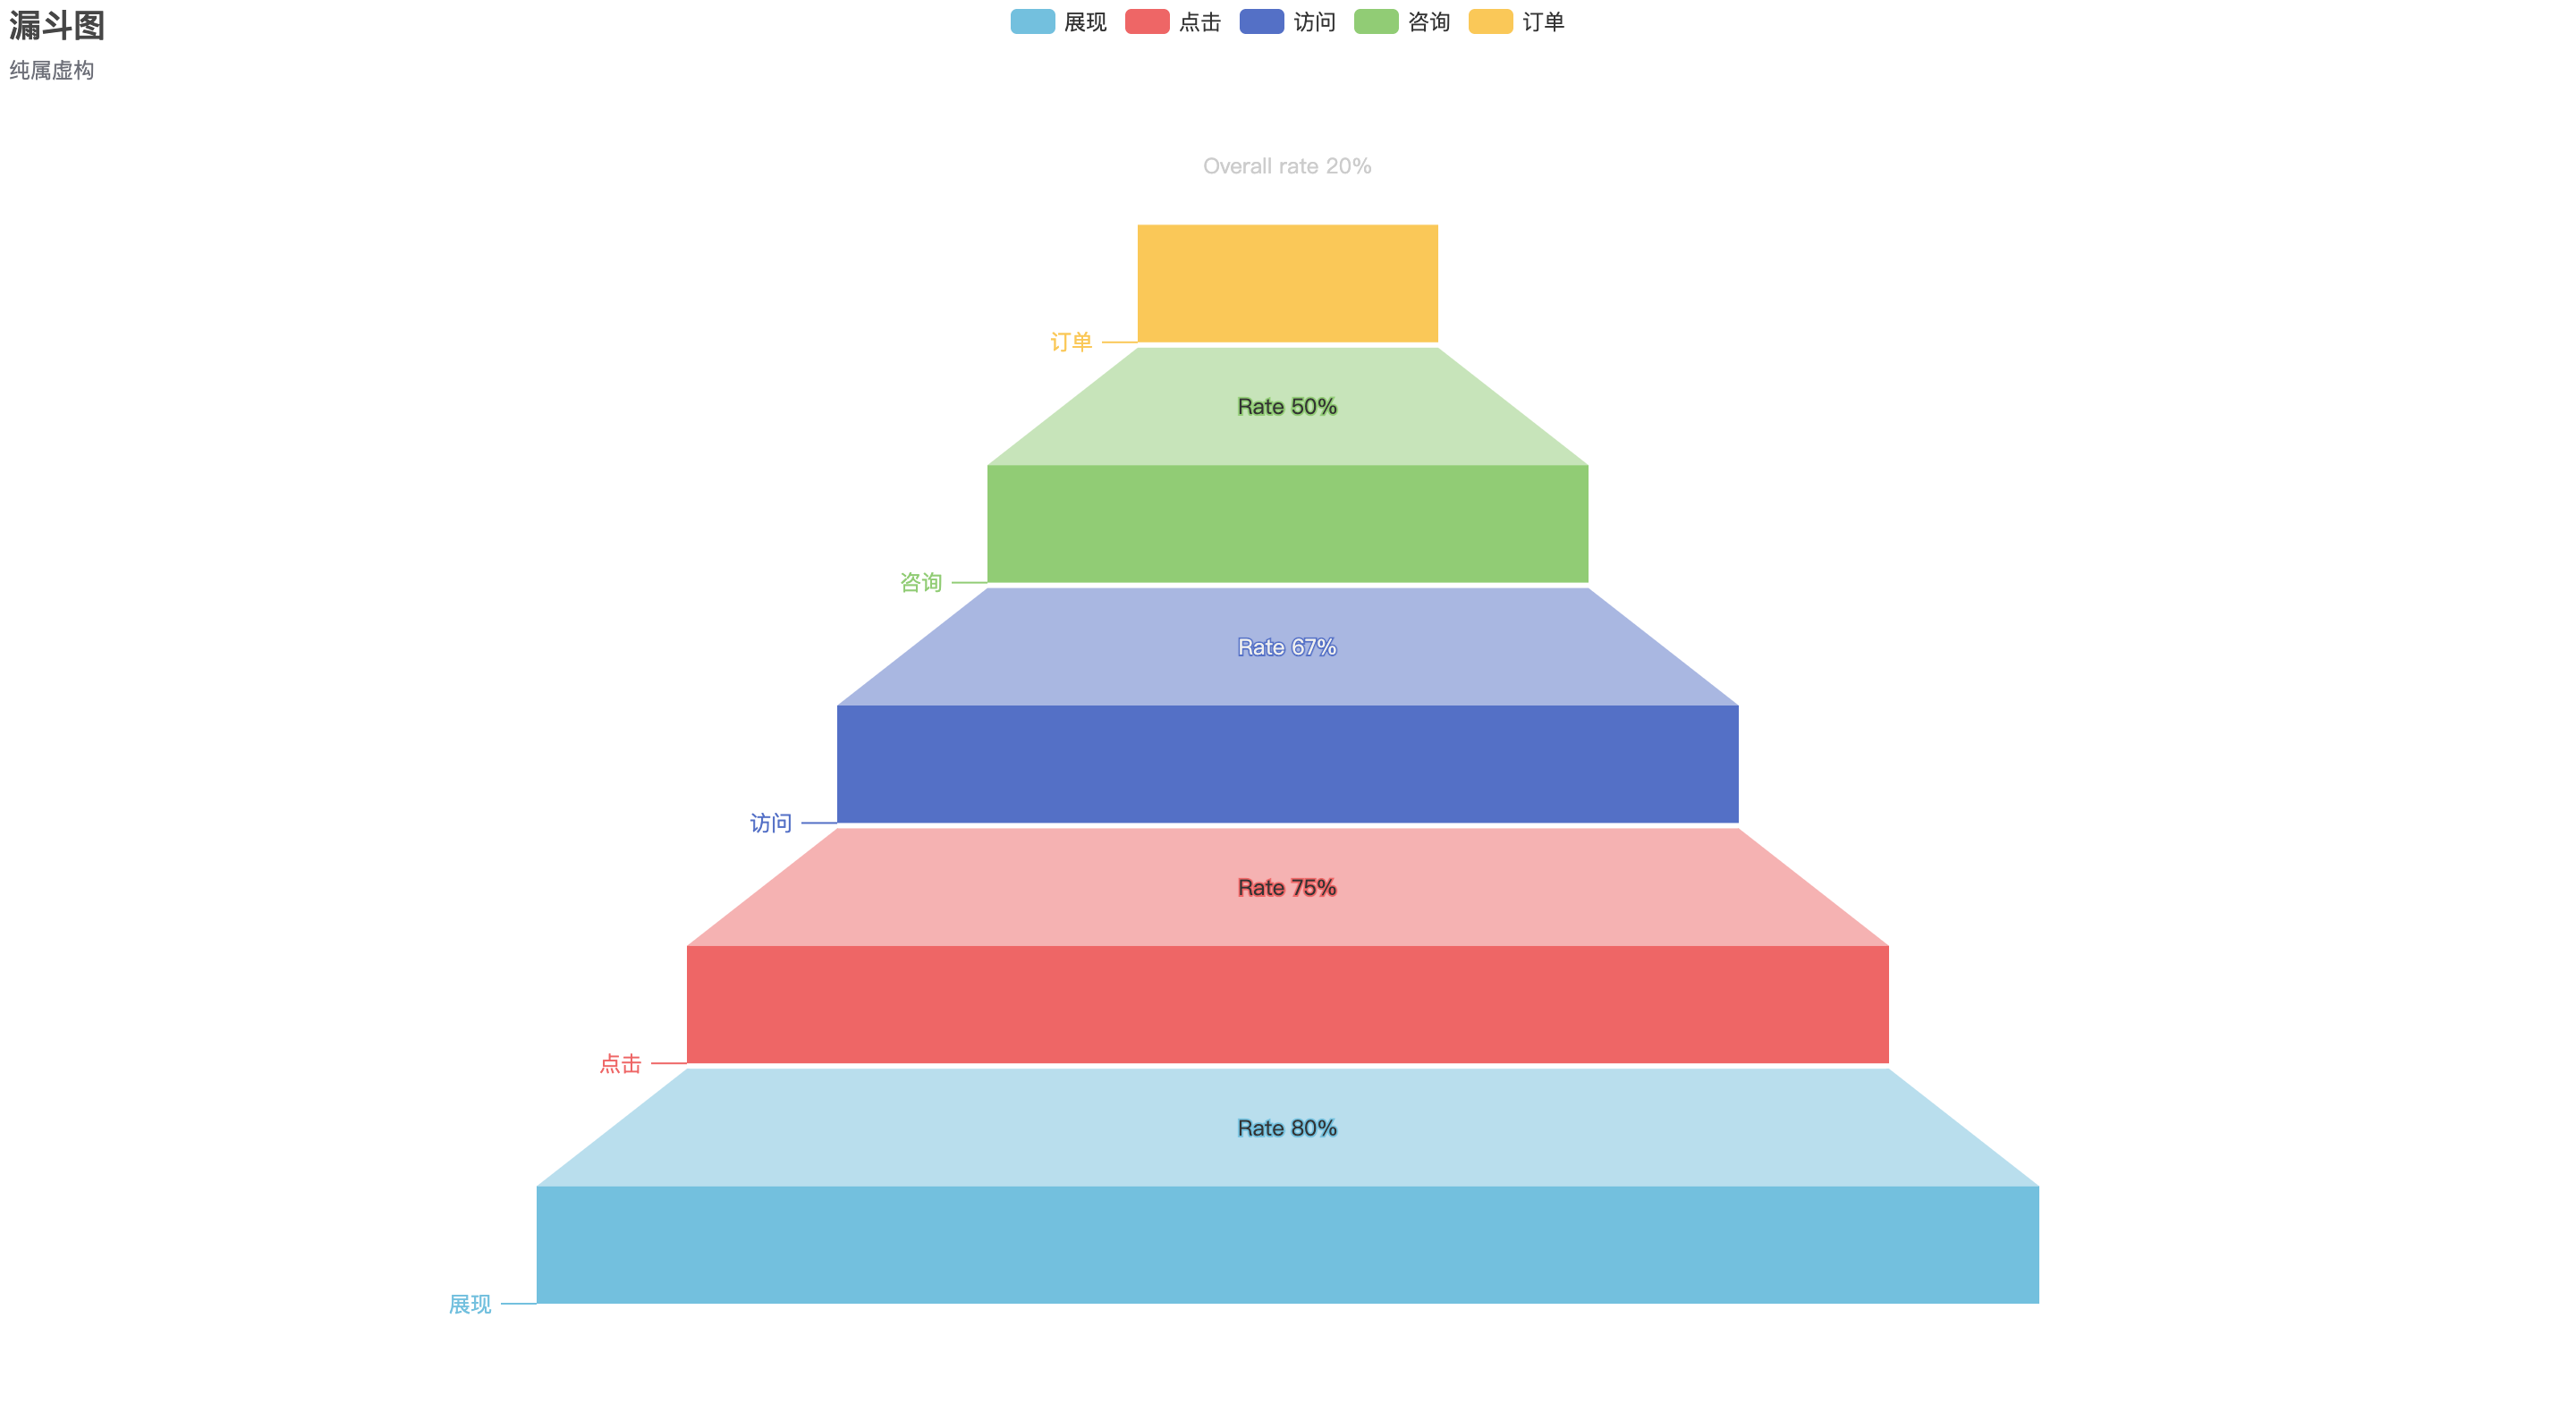
- If you want make the previous funnel last piece a trapezoidal, plese set
exitWidthas a percentage string between 0% and 100% such as'33%'.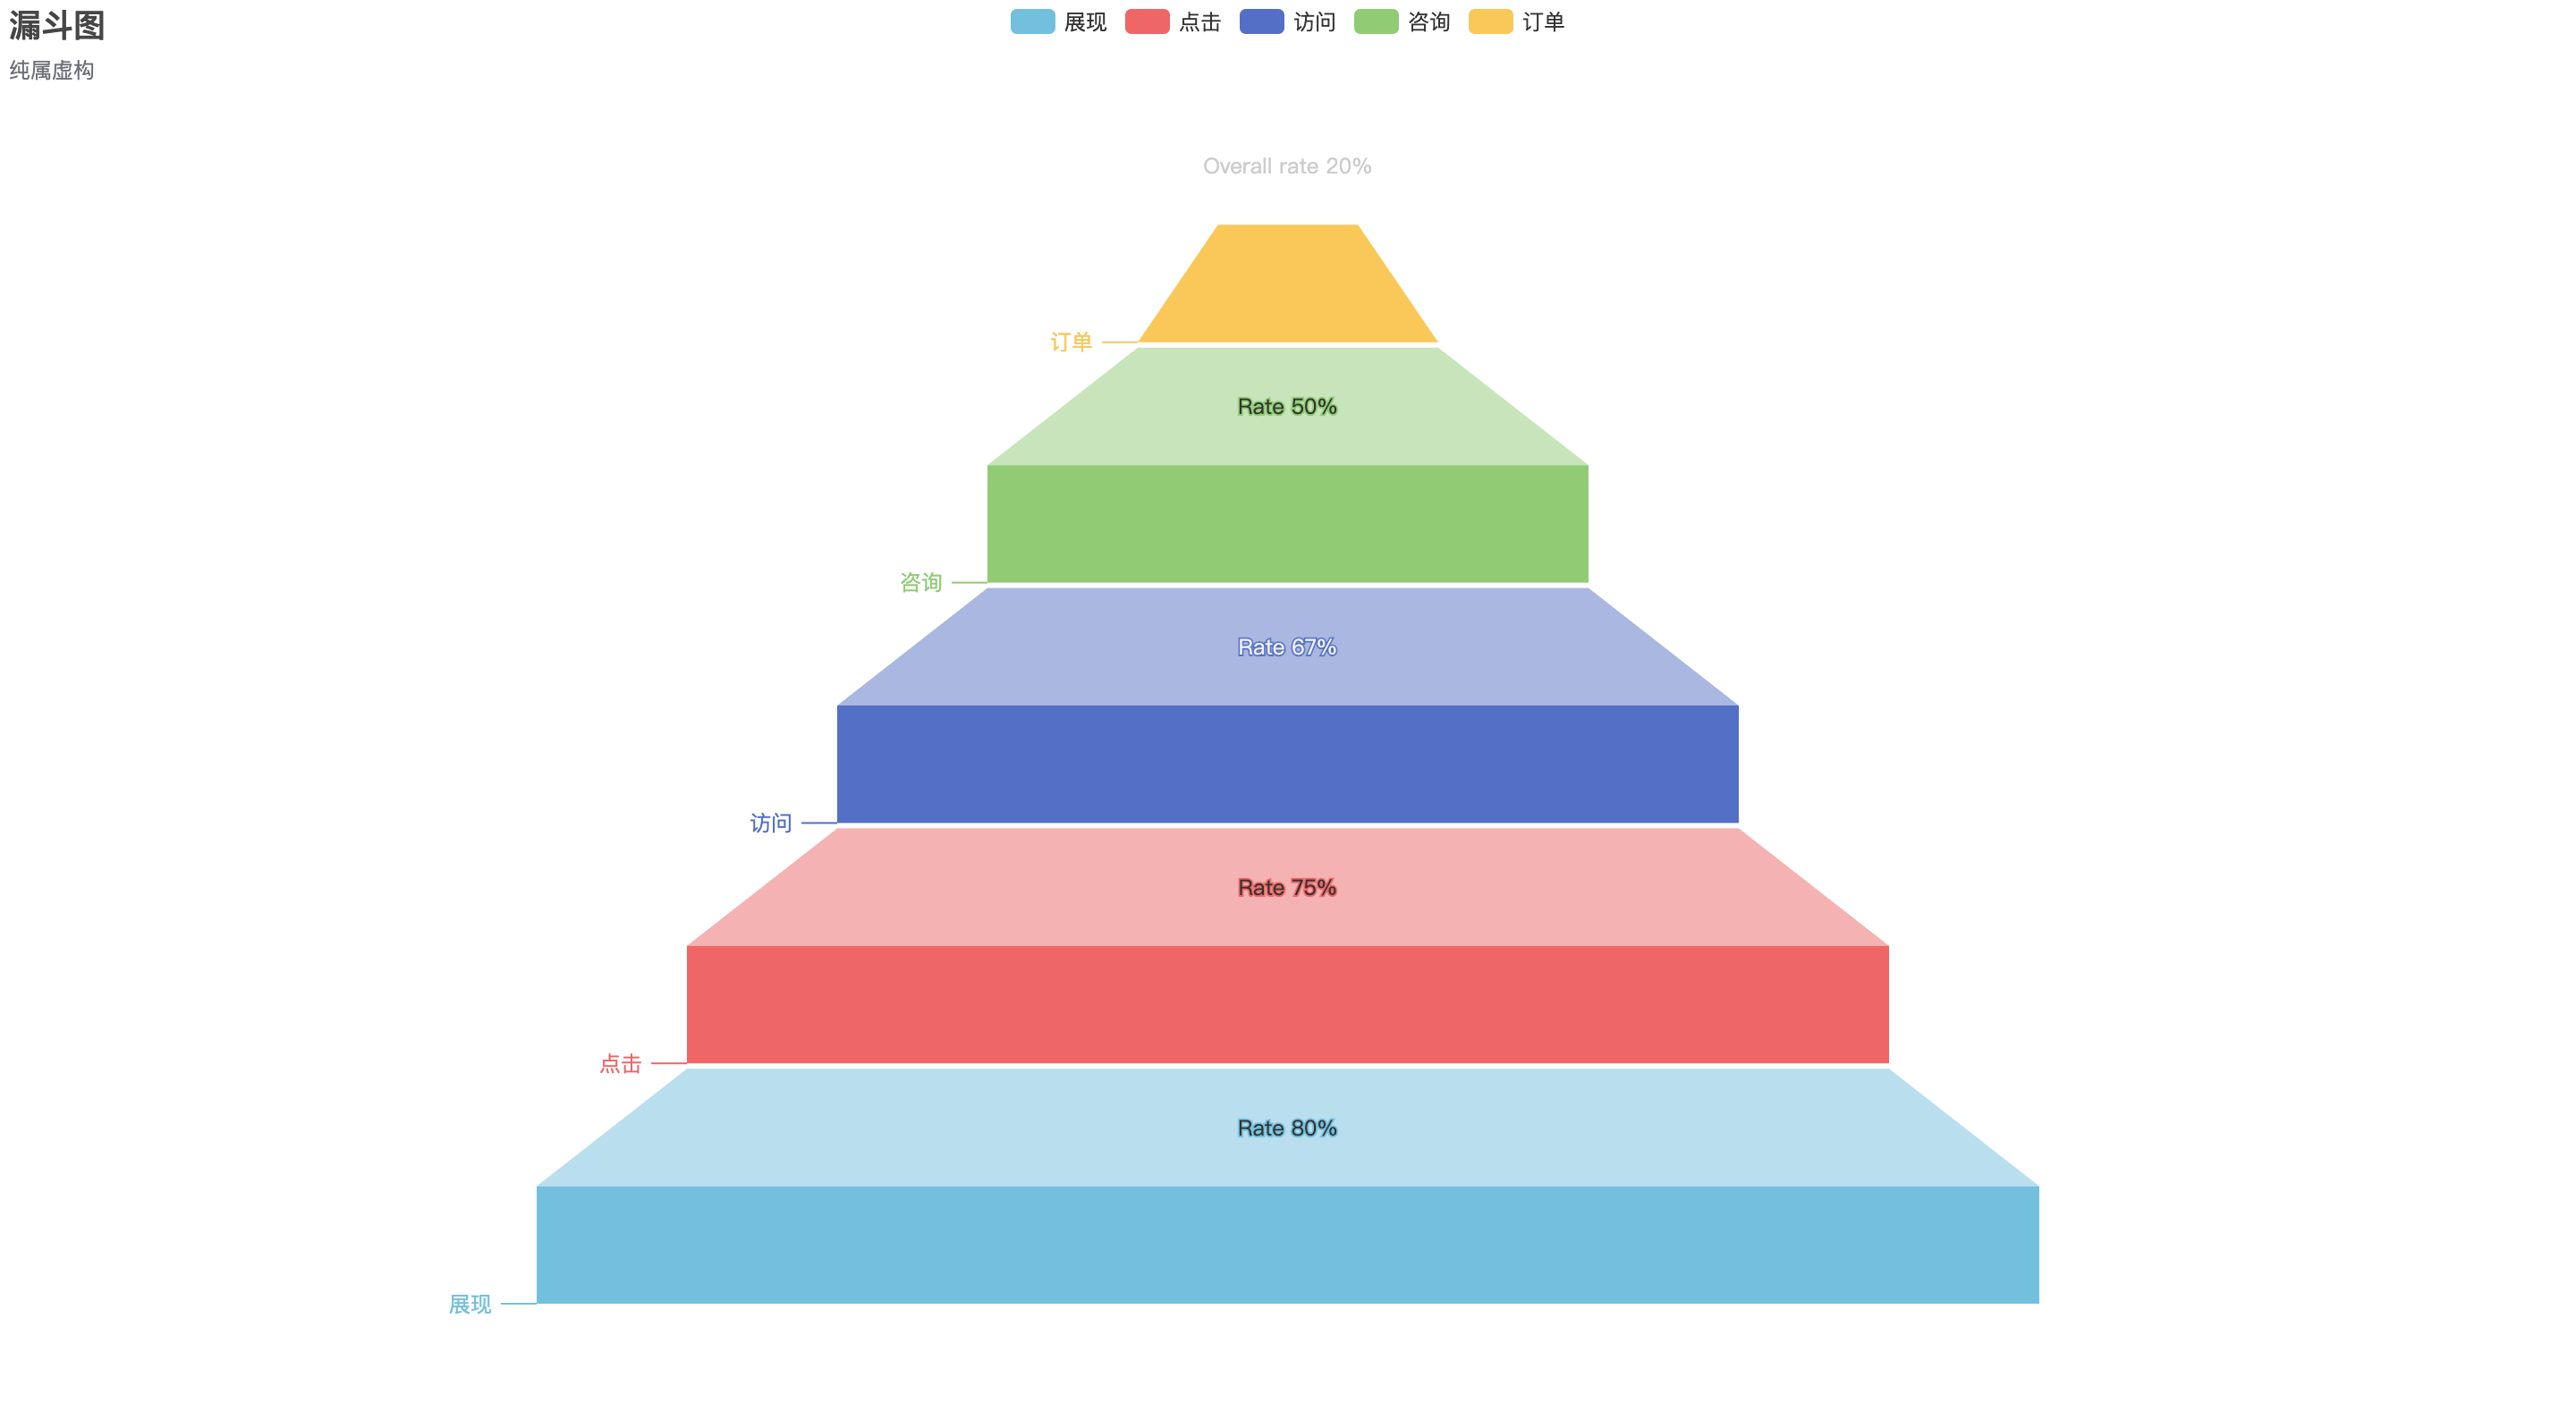
- If you want each data take funnel's area, please set
dynamicAreaastrue.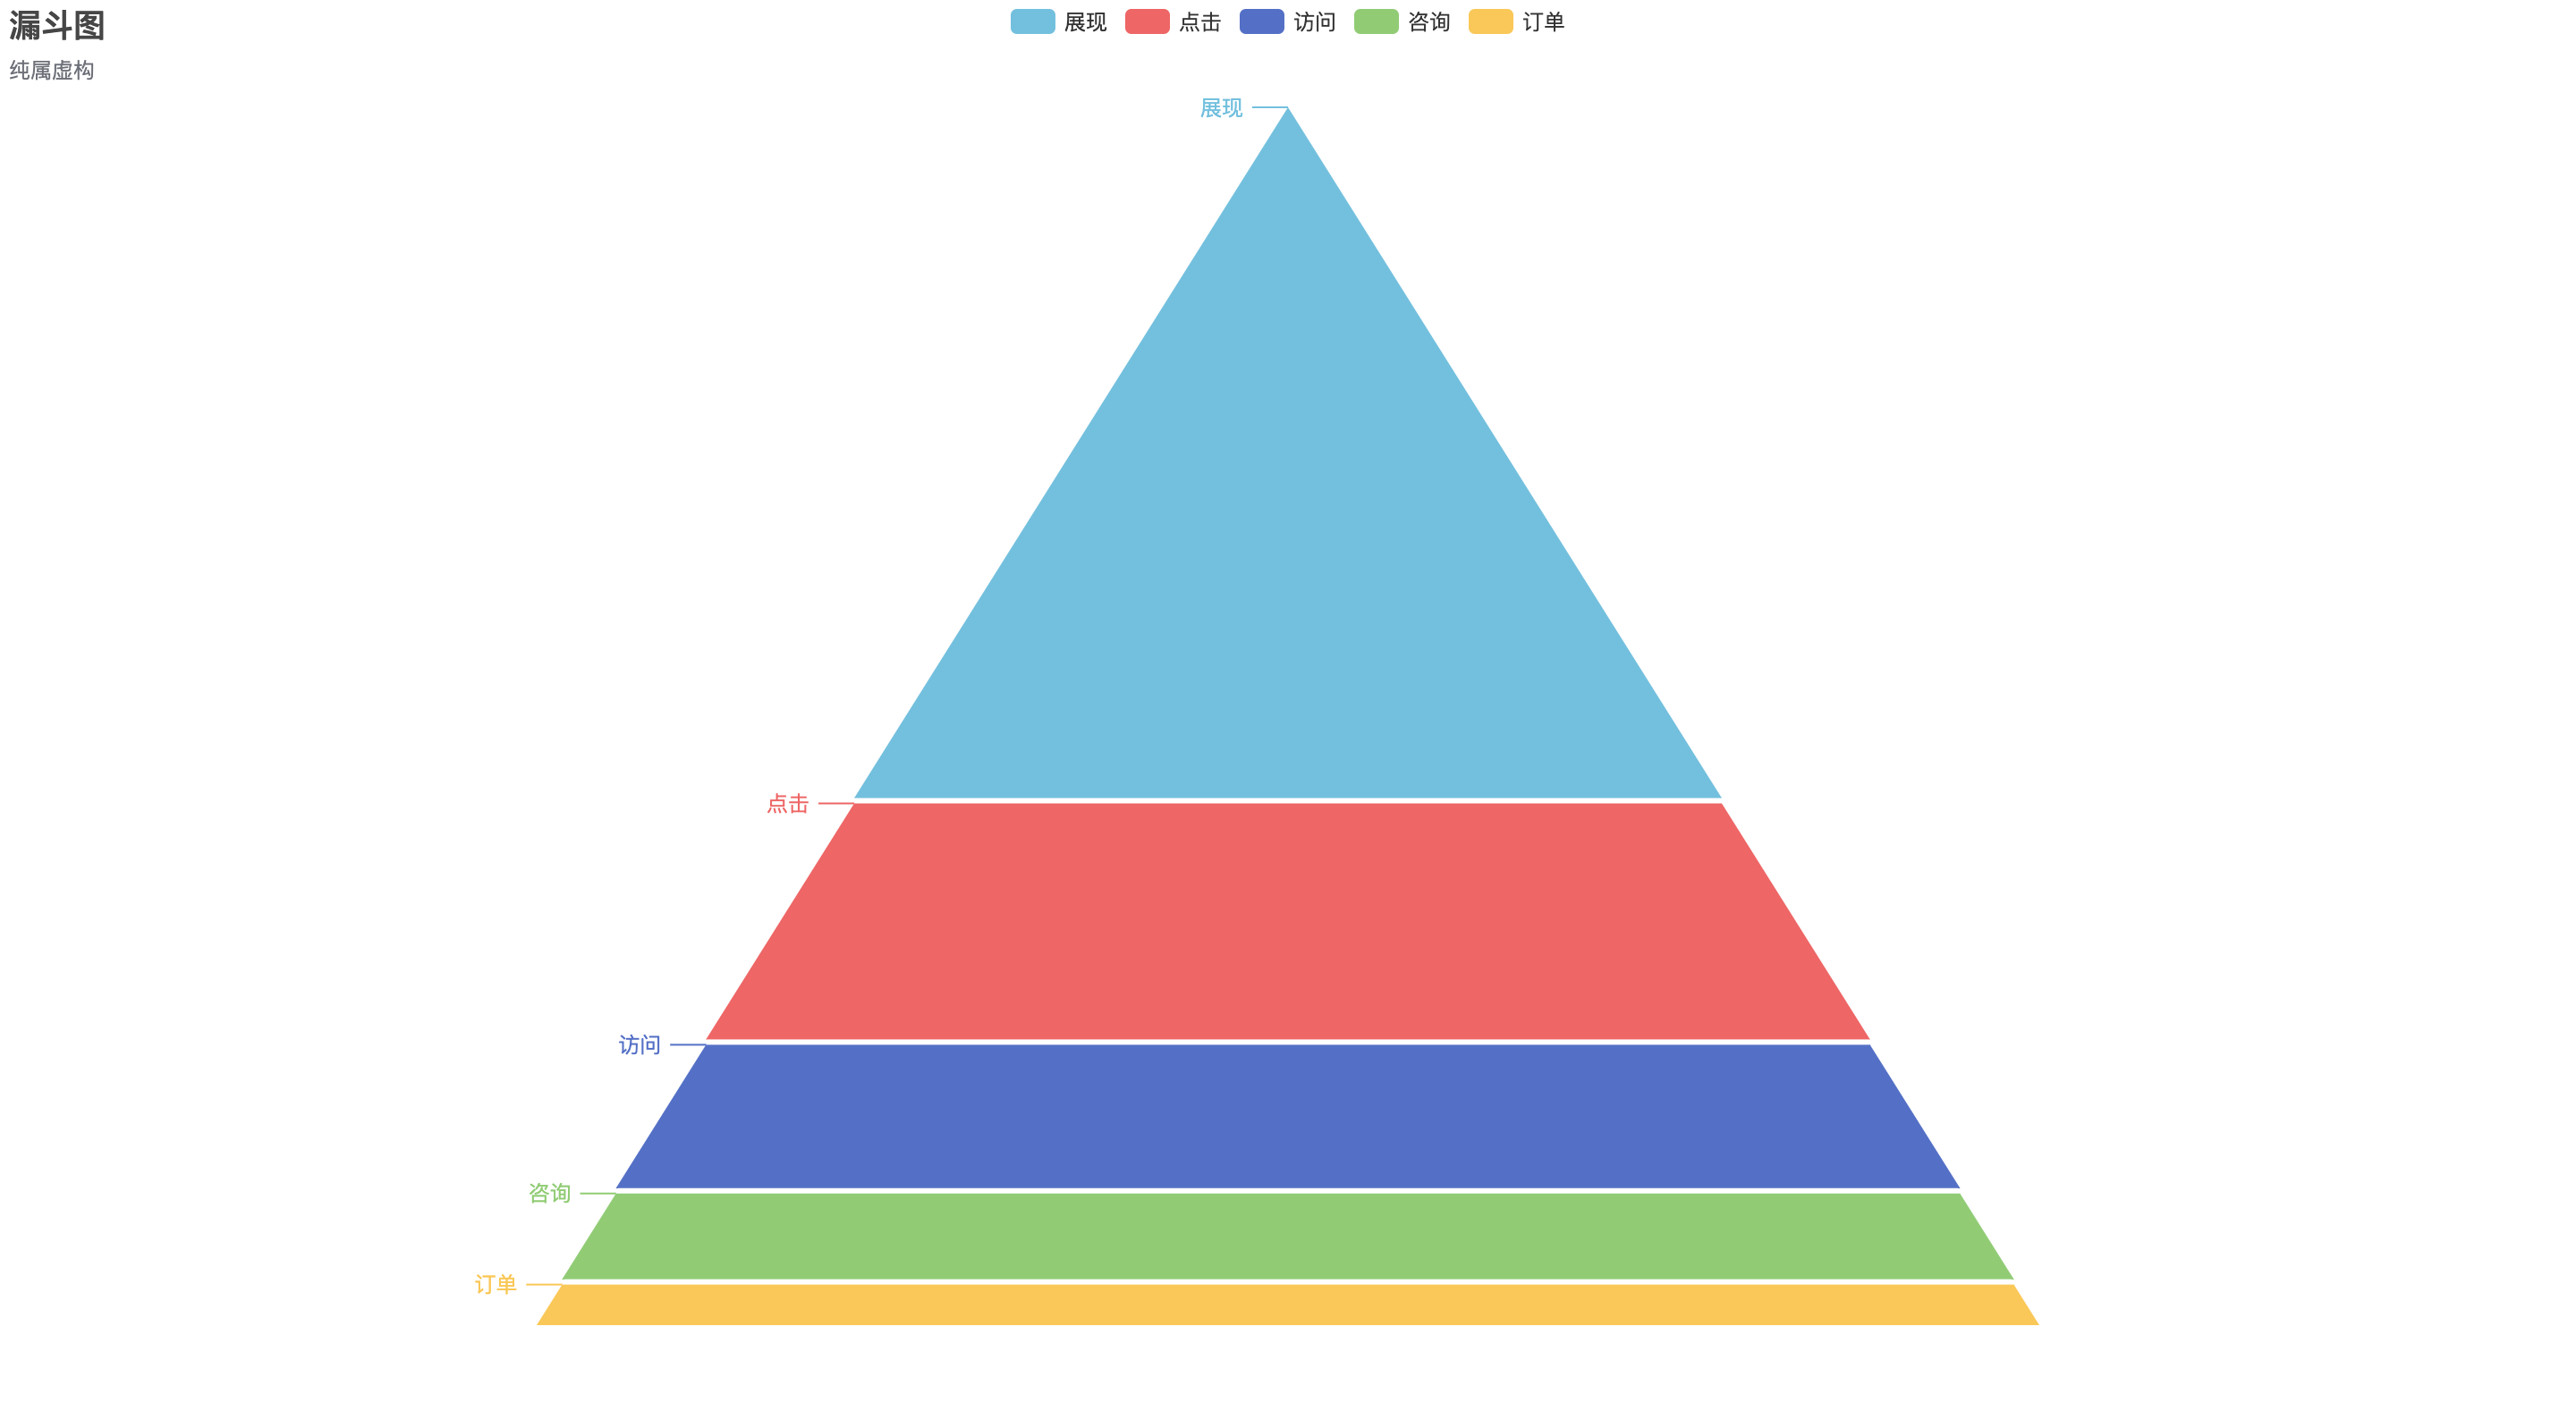
More: New attribute explanation
-
exitWidth, this property is to set the top width of the top funnel block, taking the bottom width of the piece as the base. Application scenarios: figure 1 and figure 5. Invalid whendynamicAreais valid; -
dynamicHeight, this property will let each data take it's funnel piece height. -
thickDegree, this property is control then thick degree of then dynamic height funnel, if you set this prop greater than 0% ,the funnel will thicker than default. -
showRate, this property will show rate pieces between each data, invalid when dynamicHeight or dynamicArea is true. -
dynamicArea, this property will let each data take funnel's area, priority lower than dynamciHeight.
- [ ] This PR doesn't relate to document changes
- [ ] The document should be updated later
- [x] The document changes have been made in apache/echarts-doc#xxx
related doc pr https://github.com/apache/echarts-doc/pull/281
Misc
ZRender Changes
- [ ] This PR depends on ZRender changes (ecomfe/zrender#xxx).
Related test cases or examples to use the new APIs
Please refer to test/funnel.html N.A.
Others
Merging options
- [x] Please squash the commits into a single one when merging.
Other information
Thanks for your contribution! The community will review it ASAP. In the meanwhile, please checkout the coding standard and Wiki about How to make a pull request.
Document changes are required in this PR. Please also make a PR to apache/echarts-doc for document changes and update the issue id in the PR description. When the doc PR is merged, the maintainers will remove the PR: awaiting doc label.
Please update the description of this PR to add the overall changes of options.
To be honest, I don't like the idea of dynamicHeight from the perspect of data visualization because it may cause much misunderstanding. But I understand this may be a common requirement so we can provide this option.
But dynamicHeight is not a good name because it does not tell how it works with dynamic. From the description, I understand that the height is relative to the data. So we should probably present this information in the name.
#17566 suggests using the area of the shapes to represent the data. Although you don't have to implement this feature in your PR, you should probably better design the API to make that feature possible in future PRs.
FYI, pie series use roseType, although I'm not sure if this is useful.
To be honest, I don't like the idea of
dynamicHeightfrom the perspect of data visualization because it may cause much misunderstanding. But I understand this may be a common requirement so we can provide this option.But
dynamicHeightis not a good name because it does not tell how it works with dynamic. From the description, I understand that the height is relative to the data. So we should probably present this information in the name.#17566 suggests using the area of the shapes to represent the data. Although you don't have to implement this feature in your PR, you should probably better design the API to make that feature possible in future PRs.
FYI, pie series use roseType, although I'm not sure if this is useful.
I also find this attribute suboptimal,what about dyamicMode, and it's alternative values are height and size.
Please also update the visual test case by recording the changes of the GUI to test different cases.
-
npm run test:visual - Select
funnel.htmland clickRecord Interaction - Click
Newat the top-right corner and pressALT + Rto record - Change the values in the GUI and
ALT + Rto stop - Commit the changes in
test/runTest/actions
Congratulations! Your PR has been merged. Thanks for your contribution! 👍
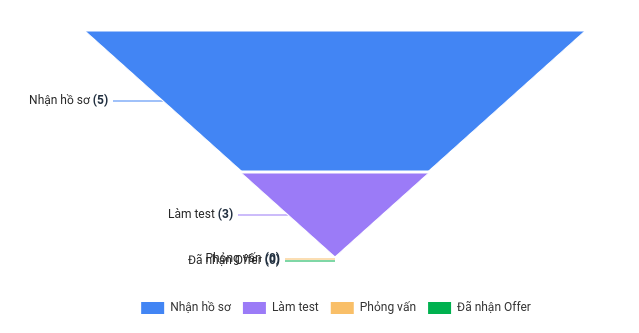
@pe-3 when the value of the last two items is 0, the label will be displayed like this. How can I solve that problem?