[Bug] Chart is getting rendered beyond the chart area
Version
5.3.0
Link to Minimal Reproduction
https://echarts.apache.org/examples/en/editor.html?c=radar&version=5.3.2
Steps to Reproduce
- Create any Radar Chart
- Change the max value in indicator more than the data value
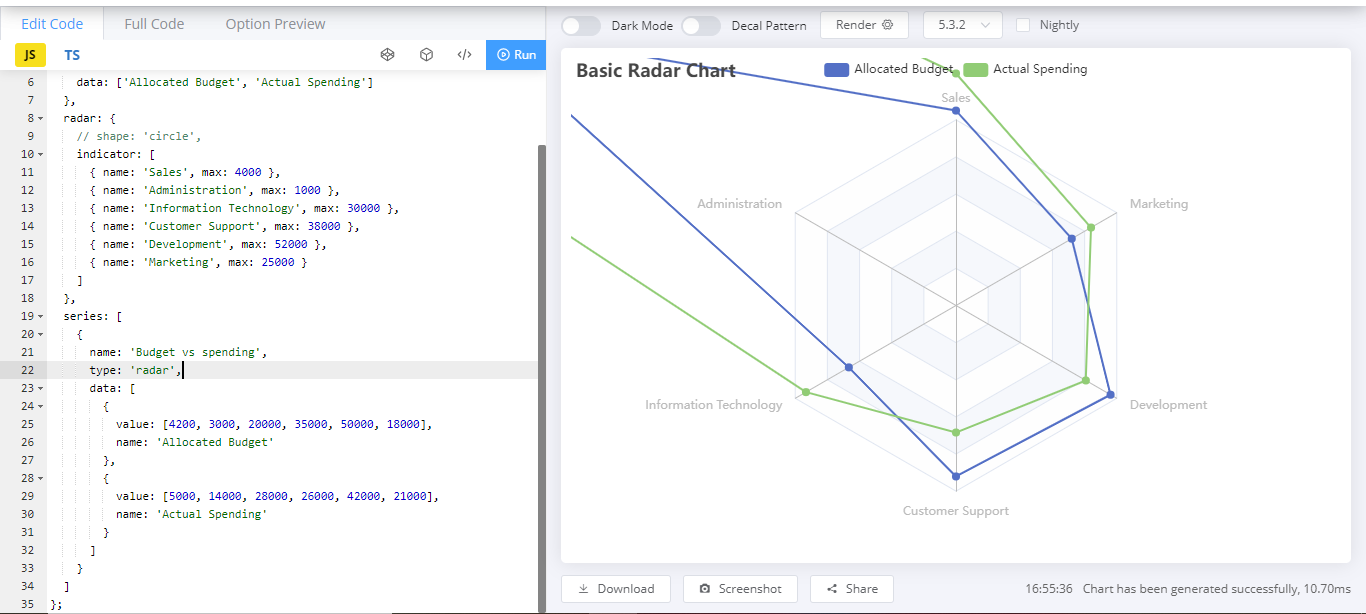
Current Behavior
Chart is plotting beyond the chart area
Expected Behavior
Chart which is plotted beyond the chart area should not be shown.
Environment
- OS:
- Browser:
- Framework:
Any additional comments?
No response
I think it's because the max value is too small. What is your expected effect of this?
@jiawulin001, ya I gave max value small compared to the data value. So, my expectation is that it should hide the values more than the max value.
May I ask why such behaviour (hide overshooting value) is needed? Normally the value should be kept below the maximum value by user. And this weird overshooting outfit can serve as a reminder that value is exceeding the maximum value.
@jiawulin001, we have one functionality just to see the values which will fall under this value.
@jiawulin001, we have one functionality just to see the values which will fall under this value.
I am not sure what that means, but that sounds solvable by data preprocessing before feeding data to Echarts.
@jiawulin001, But I need that particular indicator and value should not be 0 it should connect to other indicator value as straight line.
This issue has been automatically marked as stale because it did not have recent activity. It will be closed in 7 days if no further activity occurs. If you wish not to mark it as stale, please leave a comment in this issue.
This issue has been automatically closed because it did not have recent activity. If this remains to be a problem with the latest version of Apache ECharts, please open a new issue and link this to it. Thanks!