Chart is not rendering properly when category axis values are numbers[Bug]
Version
5.3.0
Link to Minimal Reproduction
https://codepen.io/Harshitha19/pen/NWwZNWw
Steps to Reproduce
Create a chart with numeric category values. Observe that the chart is not rendering properly.
Please look at the below sample: https://codepen.io/Harshitha19/pen/NWwZNWw
In the above sample even after Dairy Milk having a certain price value, its corresponding bar is not rendering.
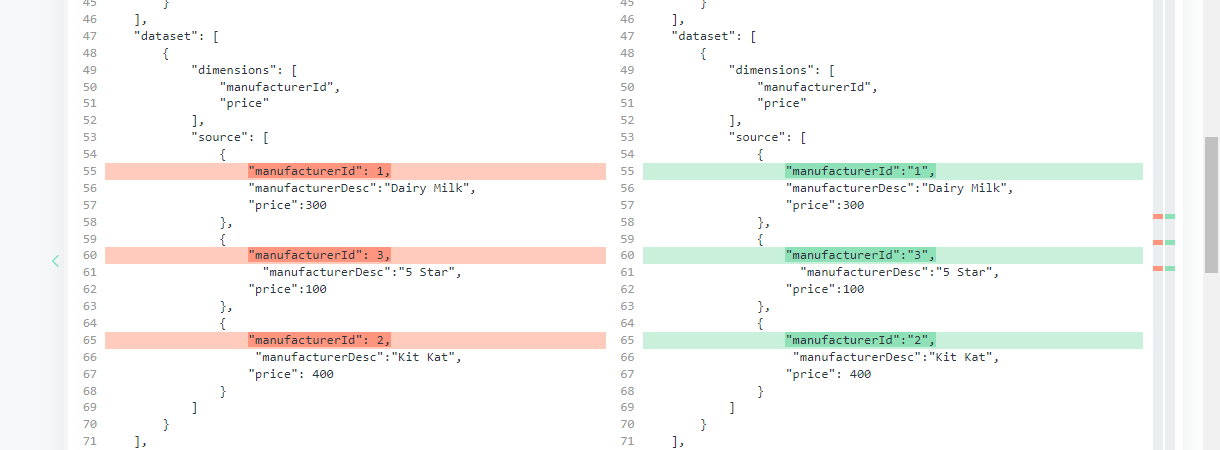
Observation: If we stringify the corresponding row value in data, the chart is plotting properly.
Current Behavior
When a chart is plotted with numeric category values, it is not rendering properly.
Expected Behavior
Chart should render properly even with the numeric category values
Environment
- OS:
- Browser:
- Framework:
Any additional comments?
No response
I didn't see any difference after changing yAxis.data to be strings. Can you be more specific about what is wrong and what is expected?
I didn't see any difference after changing
yAxis.datato be strings. Can you be more specific about what is wrong and what is expected?
We need to convert row dimension values present in the data to strings.

https://codepen.io/Harshitha19/pen/mdxMNmY
Hi, We also have similar use case where we are rendering the charts with same labels but with unique ID's. Any suggestions/ workaround in this regard would be much appreciated.