Druid returns wrong results for GroupBy queries over LongMax metric (rollup)
Hi! I'm having druid returning wrong / unexpected results, I have a rollup set up with daily segments, ingesting from kafka, and two metrics (count and longmax),
The query objective is to get the most recent value (even if some dimensions changed values during the day) using order-by "max(last_seen) desc" in order to get the most recent version of the rollup in the querySegment.
The query is bellow (the original query has more columns, but I keep reducing the query to make it easier):
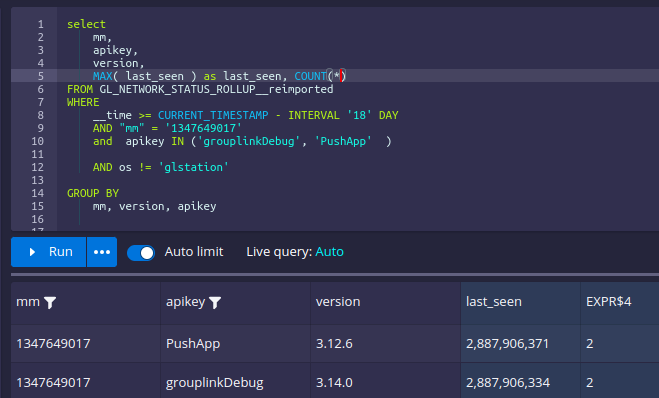
SELECT
    mm,
    apikey,
    version,
    MAX( last_seen ) as last_seen
FROM datasource
WHERE
    __time >= CURRENT_TIMESTAMP - INTERVAL '18' DAY
    AND "mm" = '1234'
    and  apikey IN ('foo', 'bar')

GROUP BY
    mm, version, apikey
The data source has data about ~30 million rows,
but the column mm was filtered and returned just 4 rows (2 for each apikey, for each day, after the rollup daily)
before rollup, on one of the days, there were 75 rows collapsed into one.
Here I set a few example data with the same schema, but no error can be reproduced with just this ingestion spec https://gist.github.com/renatocron/11a43d7ad4ee1fc3d43c4cda9a17fee2
The column last_seen is generated from the LongMax value for _time, both segmentGranularity and queryGranularity are set to DAY, so, it should always return some timestamp between midnight and the next day, but I was getting some values 30 years in the future. That was how I discovered that something was wrong with the results of some executions.
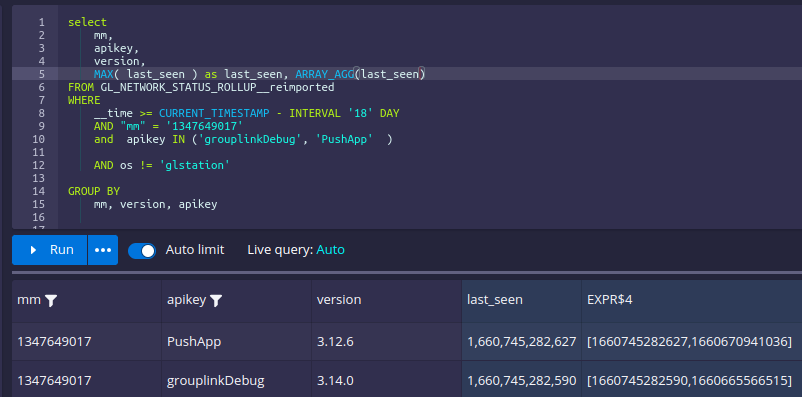
The crazy thing is, to get the correct result, I can either change the SELECT to add any column using LATEST or add array_agg(distinct last_seen), then the Max(last_seen) column returns the correct data (100% of the time? IDK,but what I would expect from a database, even without the array_agg to begin with :P [I'm not dropping shade towards druid, but that's the truth])
If you want to see it happening in 'real time', here's a video where I ran some queries https://youtu.be/X1zHJ05GoJ8
Further Information/data can be found on this slack thread: https://apachedruidworkspace.slack.com/archives/C0309C9L90D/p1661203934675279
since I reported this on Slack (2022-08-23), I keep testing to get more information:
during the initial re-ingestion from Kafka, the new data source showed wrong results initially (see https://apachedruidworkspace.slack.com/archives/C0309C9L90D/p1661248129192669?thread_ts=1661203934.675279&cid=C0309C9L90D) but after the first task was completed, the results were correct for the next ~24 hours. Then, enabled compression, the same I set on the production data source (see https://gist.github.com/renatocron/11a43d7ad4ee1fc3d43c4cda9a17fee2?permalink_comment_id=4281304#gistcomment-4281304 for the setting), and waited until today (2022-08-26) and now all the results are wrong again:
 if I add the
 array_agg
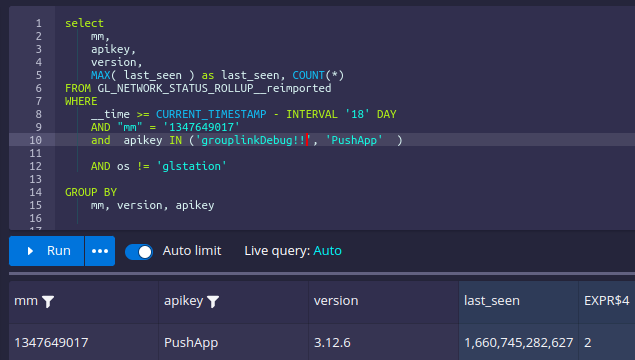
 or change the filter to only match one of the apikeys:
The reingested currenly has 14M rows and is 90.48% segments compacted, so the auto compaction is already 'done', so now I think that could be something related to the compaction process.
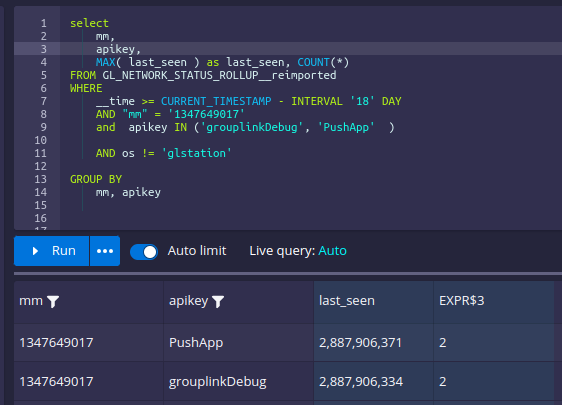
Running the query with group-by but not selecting the 'apikey' column returns the right result (and two rows, one for each apikey):
 but adding the apikey in the select, returns bad results again:
Druid version is 0.23 from the official docker image.
Thanks for reading until here!
Edit: The ingestion on this datasaource was paused since I posted this issue. Today, the query was still returning invalid results, then, before dropping this datasource, I just in case ran:
{
  "type": "compact",
  "dataSource": "GL_NETWORK_STATUS_ROLLUP__reimported",
  "interval": "2022-01-01/2022-09-15",
  "tuningConfig" : {
    "type" : "index_parallel",
    "partitionsSpec": {
        "type": "dynamic"
    },
    "maxRowsInMemory" : 250000
  }
}
and the results are right again, so I don't know if is something during the merge of multiple segment of the same period (as now each one of the segments is in perfect rollup, 1 segment per day)
Update with druid 24.0.0
I've created another query, having similar issue:
I tried running the query using the MSQE just to check if the results would match, but I got a exception during the execution
java.lang.RuntimeException: java.lang.ClassCastException: java.lang.Long cannot be cast to org.apache.druid.collections.SerializablePair
I can send the query over #slack if anyone want
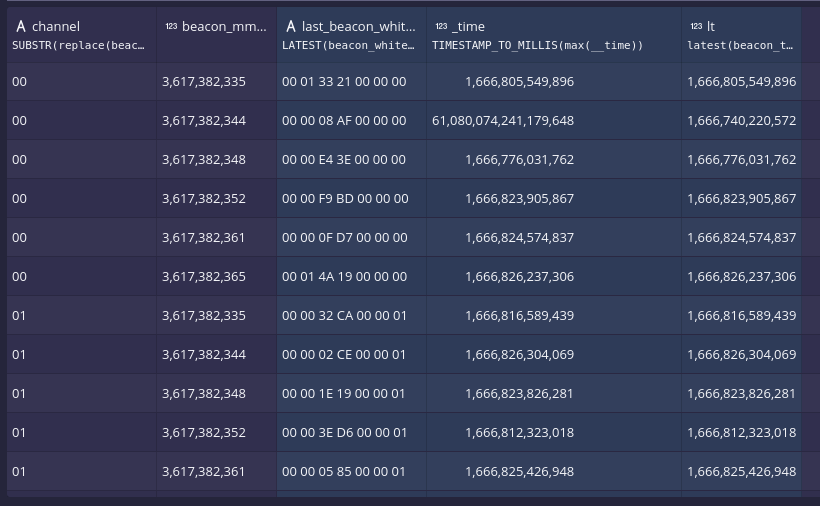
select SUBSTR(replace(dim4, ' ', ''), 13, 2) as channel , dim1, LATEST(dim4, 20) as last_dim4,
TIMESTAMP_TO_MILLIS(  max(__time)) as last_time,
latest(same_values_as_time_but_in_a_col, 100) as lastest_time

from GL_ALL_MSG_SERVER_TIME
where __time > CURRENT_TIMESTAMP - interval '24' hour
and dim1 in (about 30 ids)
and dim1 not in ('587928651', '686772016', '580255048')
AND NOT (dim2 like 'yes%')
AND NOT (dim3 != 32 and dim4 like '% 01')
group by 1,2
thanks for posting the bug. Appreciate the level of detail that you have put here. I don't know yet what might be happening. I do recall seeing a similar issue. I will take a closer look in some time.
@renatocron - I tried reproducing it on 24.0 but didn't get the wrong results. can you list the steps to reproduce on 24 version?
Hello @abhishekagarwal87 I can't really reproduce it easily, it happens randomly depending on the filters I choose
The original issue as open with a daily rollup, when I I open this issue I re-imported ~ 30 days of events from kafka, and during the ingestion while the segments were created, I had a few invalid results, then when I stopped the overload and run the query again, the results were OK, then I let auto-compaction runs with type=range and the issue appeared, then when I manually re-indexed with 'hash' the issue was gone
This week, with the datasource I posted is not a rollup, and is using dynamic auto-compression, with PT72H delay, and my query is using where __time > CURRENT_TIMESTAMP - interval '24' hour so I think we can skip auto-compaction from the equation
~~Note that this week issue only appeared when I added TIMESTAMP_TO_MILLIS to the max(__time) expression, when I run this only with max(_time) I did not see any invalid result, and now looking over, the original issue disappears when I added latest or array_agg and this week query is using LATEST as expression, so maybe it's not the same bug~~
Edit: It also appear when using just max(_time)

-- edit 2: this is completely random (as new data keeps coming on the MM), I was not able to get the invalid result again after this capture (I was 'lucky' to get this result the first time I run this today) but I already run this query again ~ 30 times with the correct results...