Memory leak caused by window.location.reload()
Bug Report
Problem
What is expected to happen?
We have an cordova android application which might be reloaded automatically for many times during development - we are using window.location.reload(). We didn't expect there is any issue of this approach.
What does actually happen?
However, we found after running for a while, it crashes during to out o memory error. Everytime it is reloaded, the memory increases some and it keeps increasing, never drop. And this issue can be reproduced using Hello World cordova application.
Information
I followed https://cordova.apache.org/docs/en/10.x/guide/cli/ to create a Hello World cordova android application and I reproduced this out of memory issue.
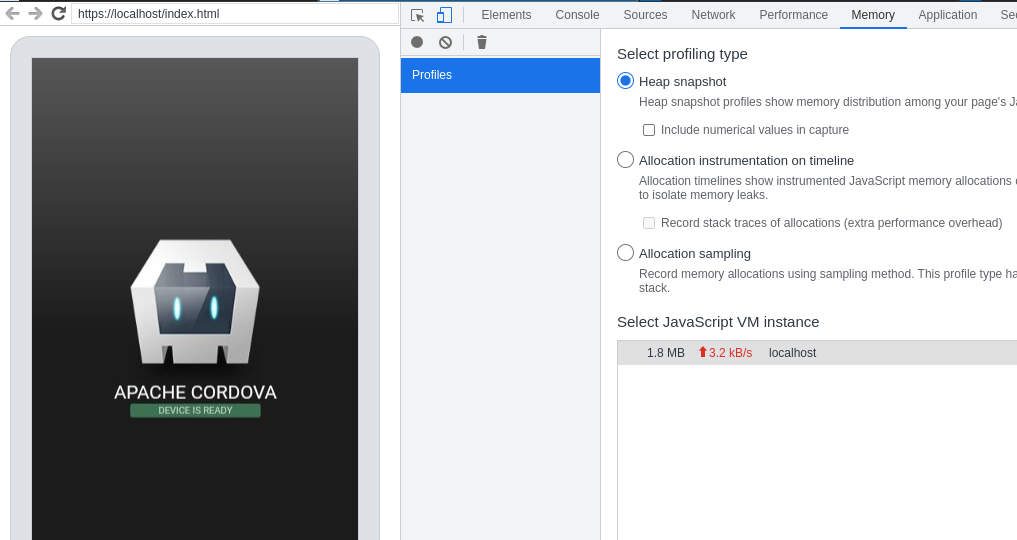
The first time I open it, the memory usage is 1.8 MB.
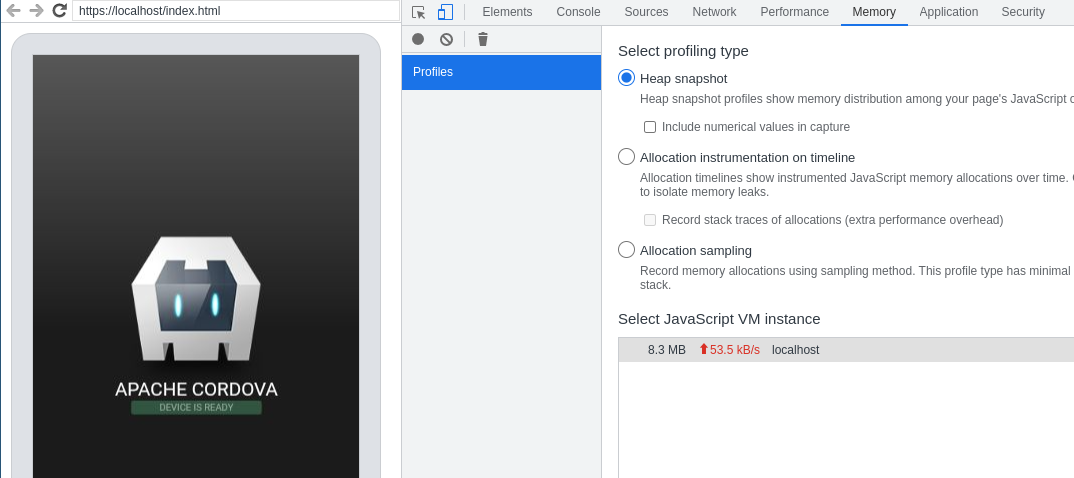
After I execute "window.location.reload()" for 30 times. the memory is increased to 8.3 MB (it is expected to be a number around 1.8 MB). And this number is kept there, never drop.
If I continue and execute enough times, eventually the app will crash.
Command or Code
window.location.reload()
Environment, Platform, Device
My host is Fedora 33, and I am testing it in Android Emulator API 33, connected with Chrome Remote Debugger.
Version information
Cordova version 11
Checklist
- [ x] I searched for existing GitHub issues
- [ x] I updated all Cordova tooling to most recent version
- [ x] I included all the necessary information above
I am not sure if this is a cordova bug or maybe there is another method I should use to reload the application to avoid this out of memory issue? or maybe I should turn off any configuration to avoid this issue?
Is there any workaround if this issue is a technical limitation or hard to fix? Any kind of helps are really appreciated!
Not sure about any workarounds, especially since we don't know the cause but I'd be curious if native event listeners are cleared/reset. Such as the one that hooks a callback for the deviceready event, which I believe gets initialized regardless if there is a JS event listener or not.
Reloading the entire application is generally what I do, but I don't have my projects configured in a way that I can simply edit the www sources and reload the webview to get them (e.g. no development server or using cordova serve, etc...). And I do understand the performance benefit of being able to do this, from a development speed perspective. I guess I do reload the webview sometimes when troubleshooting/debugging issues, but I've never ran into this memory leak, or at least to the point that it actually causes a OOM.
Also note that the web inspector Memory tab includes memory consumed by the dev tools itself. So if you have persistent logging enabled so that console.logs are kept across reloads for example, constantly reloading will gradually increase memory. Same goes for persistent network information or keeping audits, etc. If you're finding yourself with very large console output that you're keeping around, I'd try clearing it, and once the JS garbage collector does it thing, you should see the memory usage get reflected in the Memory tab.
@breautek Thanks for your reply! I do understand that if the application code is not written in a right way, it might cause OOM,, but as I said, I reproduced this issue in the Hello World application created by following the https://cordova.apache.org/docs/en/10.x/guide/cli/ - be more specific, I am using the command "cordova create hello com.example.hello HelloWorld", and in its index.js, there are only the following lines.
document.addEventListener('deviceready', onDeviceReady, false);

function onDeviceReady() {
    // Cordova is now initialized. Have fun!

    console.log('Running cordova-' + cordova.platformId + '@' + cordova.version);
    document.getElementById('deviceready').classList.add('ready');
}
When you are talking about "reload the webview sometimes ...", do you mean clicking the Refresh button in Remote Debugger or use "window.location.reload()"? Based on my observation, clicking Refresh button is working fine (no OOM), but "window.location.reload()" does cause OOM.
I uploaded the Hello World app here so you can give it a try (it is actually a .apk file, but github does allow to upload .apk, so I add .zip in the file name. So you will have to remove .zip from the file name) app-debug.apk.zip
Regarding what you said about the web inspector, I totally agree and I did be aware of those and I am sure that I have disabled those settings when I reproducing this issue.
Another thing I noticed that this memory increasing amount might be related to the resources loaded. For example, for the Hello World application, 30 times reload increases the memory from 1.8 MB to 8.3 MB. But for my product project, every reload will increase about 20 MB - because it loads many third party node modules.
Is it possible that cordova cached all the resources loaded by webview, when I invoke "window.location.reload()", cordova didn't clear the old cache data and added new cache data, therefore, the memory is kept increasing? I don't have any evidence so far, just my guess.
When you are talking about "reload the webview sometimes ...",
I mean clicking the refresh button, or using the ctrl + r keyboard shortcut. I like never use window.reload.
I don't really think Cordova caches anything. Cordova doesn't implement the webview and control over the webview is fairly limited. And everything inside the JS VM would be pretty much exclusive to the webview resources, things that Cordova cannot directly manipulate. As far as I know, resources related to a particular page is freed once the document is unloaded.
What Cordova does do however, is allow plugins to be loaded up, which can hold some state/memory/whatever, and this state can persist through webview unloads/reloads, or even a complete destruction of the underlying native webview object, for as long as the application itself isn't killed. This wouldn't be included in the JS VM memory though as seen in the chrome web inspector (unless plugins are sending stuff to the webview and creating lots of JS objects).
I don't have time to look at the application right now, but if I remember I'll try to look at it tomorrow (assuming I have power... hurricane season :D).
In the meantime though, you might get better insights if you use the memory heap tools for collecting snapshots/allocations over time, which can also record stacktraces. After running through the reproduction a few times, you might be able to see a pattern.
How large does the VM size grow anyway according to the dev tools? They can grow quite large, assuming device memory permits, up to ~1gb of RAM (regardless if device has plenty of RAM or not).
You can also load up the project in Android Studio (the android studio project will be located at <cordova-project-root>/platforms/android, and utilise the performance audit tools to keep track of memory consumption, which will give you insights on what is happening on the native side (which would include webview memory usage, but you wouldn't be able to inspect the webview memory in detail like web inspector)
Unfortunately I have to refresh the web view in programming way - it does not have to "window.location.reload()" or "history.go(0)", any other methods that I can use to refresh cordova webview?
If Cordova does not cache anything, the problem might be in the webview itself. I have also tried to load a pure static web page - just open a Bing search page, do some search, then save the HTML page to local, then upload it to www folder of the cordova application in my Andriod Emulator. After loading this static web page and refresh using "window.location.reload()" for many times, I also can see the OOM issue. So maybe it is very likely the problem is in android webview.
Yes, the RAM might be go up 1 GB, and crash after that, but sometimes it crashes at about 500 MB.
Memory heap tools and debugging native project in Android Studio are good ideas. Thanks a lot for your advice!
So maybe it is very likely the problem is in android webview.
What if you use the standard chrome browser instead of Cordova? Is it replicable using the standard browser?
If so, then you could be right here. If not, then the next test to see if the issue is replicable outside of Cordova, but using the Android webview by creating a native app with a webview. I want to say they have a template for that in Android Studio, but I'm not sure. If it does replicate in the standard mobile browser, then I feel like it's most definitely a browser thing.
If neither of these are replicates the issue and it only replicates in Cordova, then it does suggest that something that Cordova is doing is the cause.
I have ever tested standard browser - it is not replicable. Regarding "using the Android webview by creating a native app with a webview", I guess I don't have to create one myself, it should be same if I try in the chrome browser in Android Emulator, correct? Mobile browser is a native application with webview, right?
It is interesting that I found this - https://github.com/react-native-webview/react-native-webview/issues/602 . It said that window.location.reload does not work in Android webview, I am curious how it works in Cordova?
I tested calling reload on my work's web portal, which is a pretty large web app. It consumes ~40mb at a base line, and I do see the memory usage in the web inspector's Memory tab increase while calling reload. If I do it in quick succession, I can make it climb to about 300mb... but it gets garbage collected fairly quickly and eventually comes back to the 40mb base line.
This is on desktop chrome, I'm loading up an android simulator now and I'll poke around myself.
So i've reproduced the issue. The behaviour on a Cordova is definitely different than the standard webview or even the desktop browser.
Unfortunately that's about all I know... I tried building building a sample Android Webview app, but calling location.reload triggers a prompt asking if I want to open the webpage in the standard browser instead of actually reloading the webview. Cordova must override this behaviour somehow but I'm not sure how it does it. Perhaps that's the issue you have mentioned.
The android WebView class expose a clearCache API, and Cordova does have methods to call this. I'm not sure if this API is actually used at all, but it can be manually invoked from the Webview using cordova.exec(console.log, console.error, "CoreAndroid", "clearCache", []). I've confirmed using AS java breakpoints that it indeed goes clearCache(true) on the webview. According to the documentation, it should clear the resource cache in both RAM and if true is passed in, it will include disk files as well. However, I saw no change in the memory usage according to the web inspector Memory tab.
Would be interesting to get a raw Android webview test case working so that we can see if the memory issue replicates outside of a Cordova environment.
Yes, I also tried cordova.exec(console.log, console.error, "CoreAndroid", "clearCache", []) and cordova.exec(console.log, console.error, "CoreAndroid", "clearCache", [true]) . It does not help, :(.
@breautek The prompt issue you met seems not same with the one I mentioned - the one I mentioned seems just no be able to get latest web content with location.reload, no mentions about the prompt as you said.
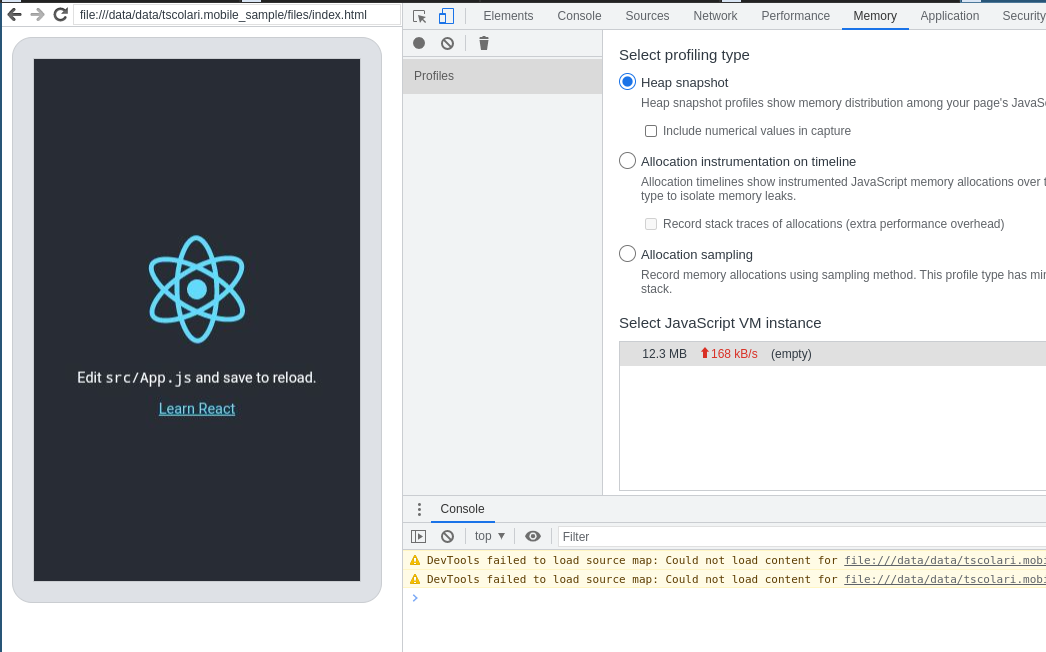
Hi @breautek , I am able to reproduce this issue in a raw Android webview. Here is my project android-webview-sample-app-master-TestMemoryLeak.zip
Because I have no background for Android development, I created the project by importing https://github.com/tscolari/android-webview-sample-app and did some modification to make it debugable and be able to load local resources.
Now this sample app will try to local web content from file:///data/data/tscolari.mobile_sample/files/index.html . You can put whatever web content in files folder and call "location.reload()" for many times in web inspector, then you will see the memory leak issue.
Here are my screenshots.
Before running "location.reload()"

After running "location.reload" for thirty times
Thanks, this will probably help.
private class MyCustomWebViewClient extends WebViewClient {
        @Override
        public boolean shouldOverrideUrlLoading(WebView view, String url) {
            view.loadUrl(url);
            return true;
        }
    }
This is probably what allows reloading without the prompt, and I want to say Cordova does something very similar. I've been pretty burnt out of programming lately so I'm not sure when I'll get to this. But I wonder if simply overridding and loading the url like it does is the actual case.
@breautek We found that this issue could be resolved by updating Android System WebView to the latest version in Google Play, so this should be an Android WebView bug and fixed in latest version already. Really appreciate your effort to help investigating this issue!!