help request: The number of connections keep increase with out any requests
Description
Hi All, We use helm chart to deploy APISIX in K8S pods, and find this phenomenon:
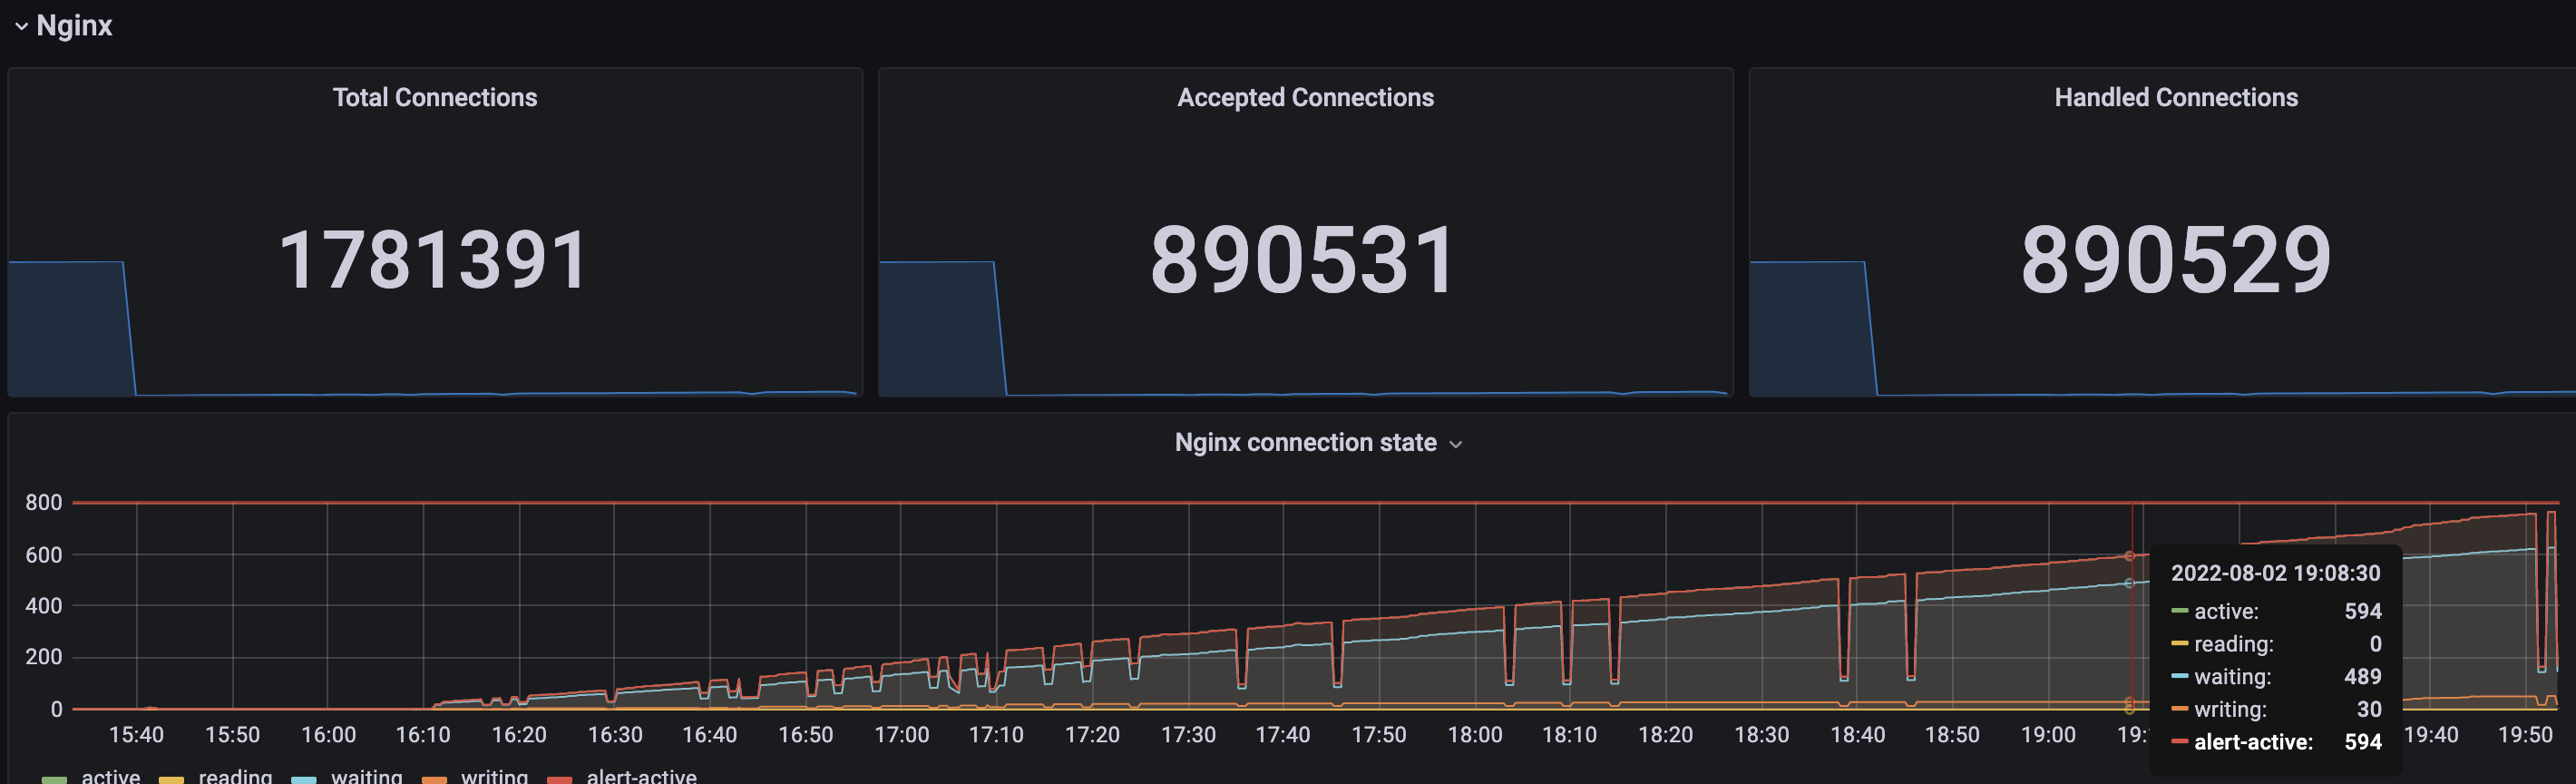
- The number of connections keeps increase, most of them are waiting connections, but during this time, we do not create any connections.
- It looks like the APISIX process restart frequently.
I have no idea on it, does any one have met this problem before?
Environment
- APISIX version (run
apisix version): 1.14.1 - Operating system (run
uname -a): Linux
- we do not create any connections.
The request may not be coming from you, but from places you are ignoring.
Let's check out how the value is calculated. These connection numbers gotten from apisix are counters which increases since apisix starts.
Prometheus will periodically call the /apisix/prometheus/metrics interface to obtain monitoring data. This also leads to an increase in the number of connections.
- we do not create any connections.
The request may not be coming from you, but from places you are ignoring.
I'm pretty sure it doesn't have any consumers due to it is new environment and haven't deliver to customers yet, APISIX dashboard should be the only service who might make request to apisix
Let's check out how the value is calculated. These connection numbers gotten from apisix are counters which increases since apisix starts.
The metrics expression is like:
sum(apisix_nginx_http_current_connections{state=~"active|reading|writing|waiting", instance=~"$instance", kubernetes_namespace=~"$namespace"}) by (state)

APISIX dashboard should be the only service who might make request to apisix
APISIX dashboard will not access the APISIX Admin API, right? cc @bzp2010
You can look at the access.log, the request information will be logged here.
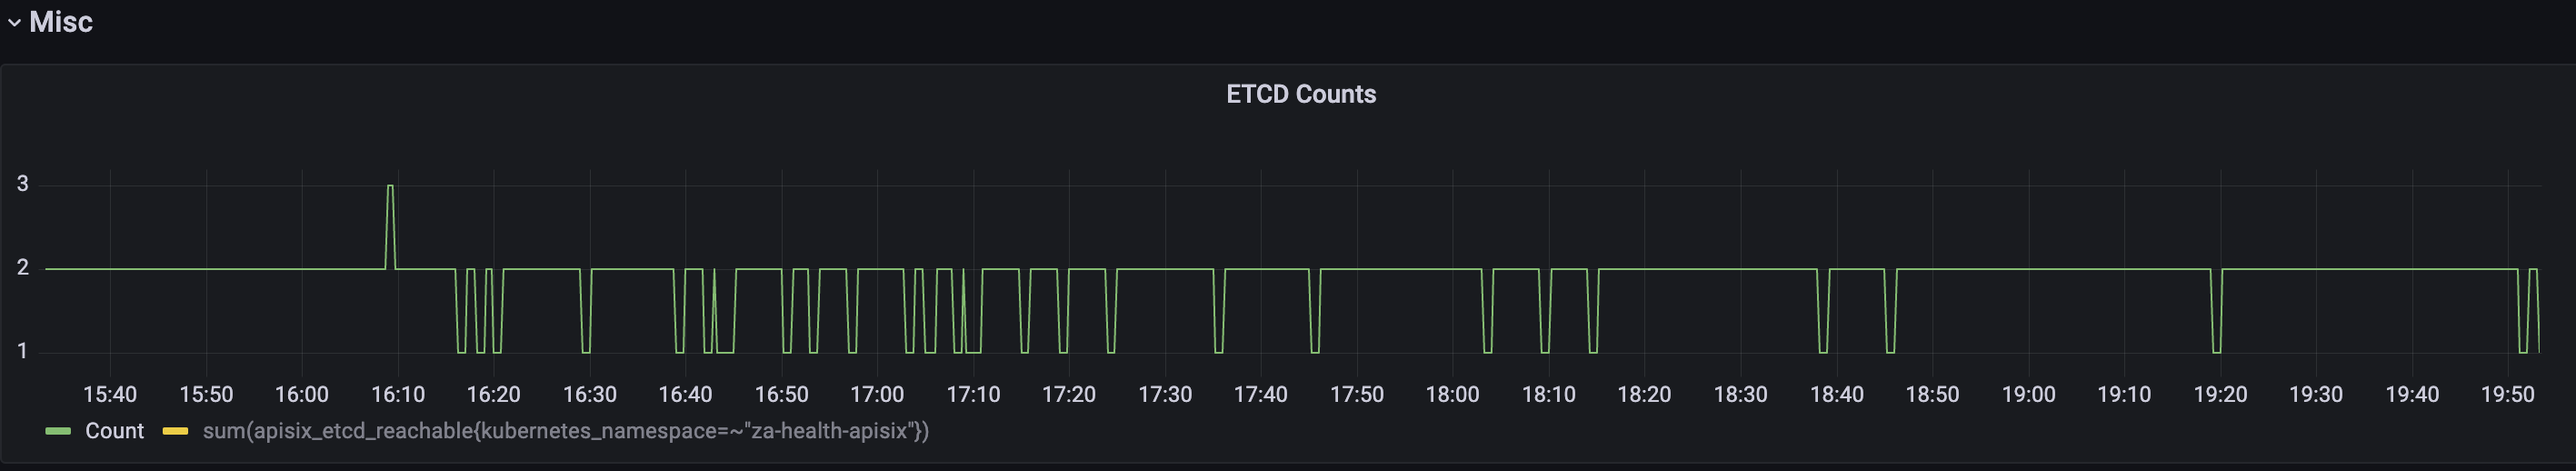
It is indeed a strange curve, it may be that the nginx worker has insufficient memory to cause the process to restart, etcd-rechable has restart behavior, and the connection is not released.
etcd-rechable has restart behavior, and the connection is not released.
yes, this problem exists in the previous version, you need to upgrade to the latest version. ref: https://github.com/api7/lua-resty-etcd/pull/165
This issue has been marked as stale due to 350 days of inactivity. It will be closed in 2 weeks if no further activity occurs. If this issue is still relevant, please simply write any comment. Even if closed, you can still revive the issue at any time or discuss it on the [email protected] list. Thank you for your contributions.
This issue has been closed due to lack of activity. If you think that is incorrect, or the issue requires additional review, you can revive the issue at any time.