How to classify the images to Good/Defective using the output of the model
Hi and thanks for the implementation that works just fine contrary to the original repo !
I have been able to use it to train on my data but I am wondering how to determine the threshold or any other startegy that allows to classify the images into good and bad at inference time as I don't think this has been implemented.
Can you also explain how should the distribution graphs shoud be interpreted ; what do the x and y axis represent ?
Thanks for your help.
@MhdKAT Thank you for your question and use!
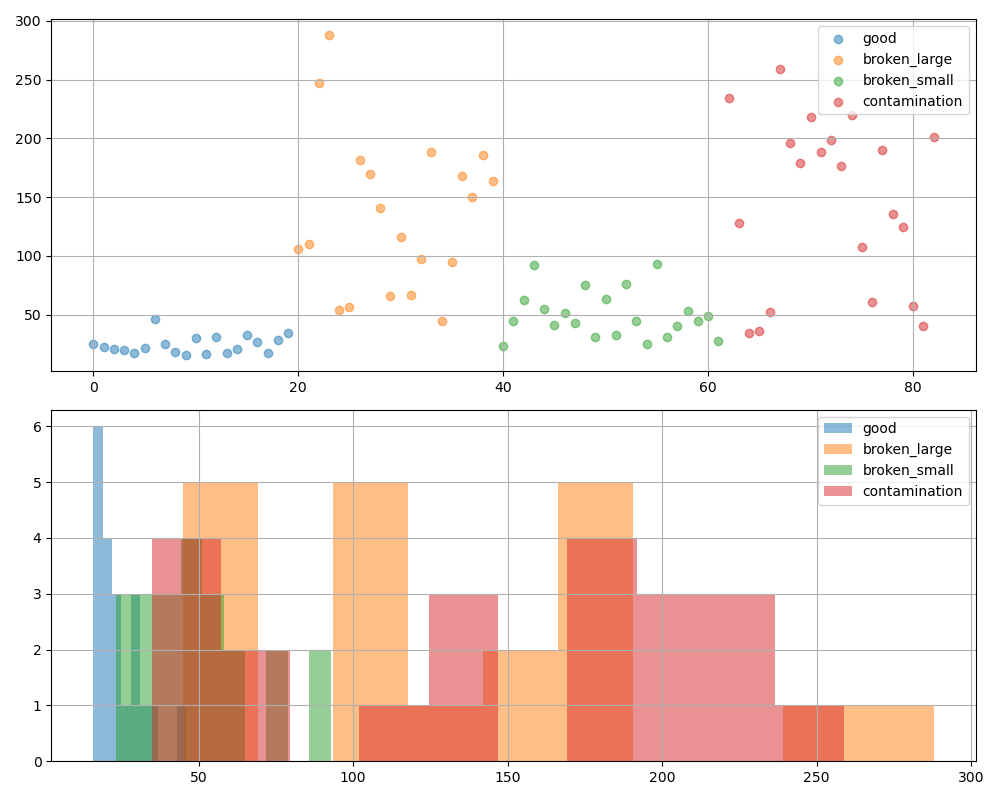
One way to determine the threshold is to look at the graph and decide intuitively. In the upper graph, the horizontal axis is the data index and the vertical axis is the SPADE's anomaly score. In the lower graph, the horizontal axis is the SPADE's anomaly score, and the vertical axis is the frequency.
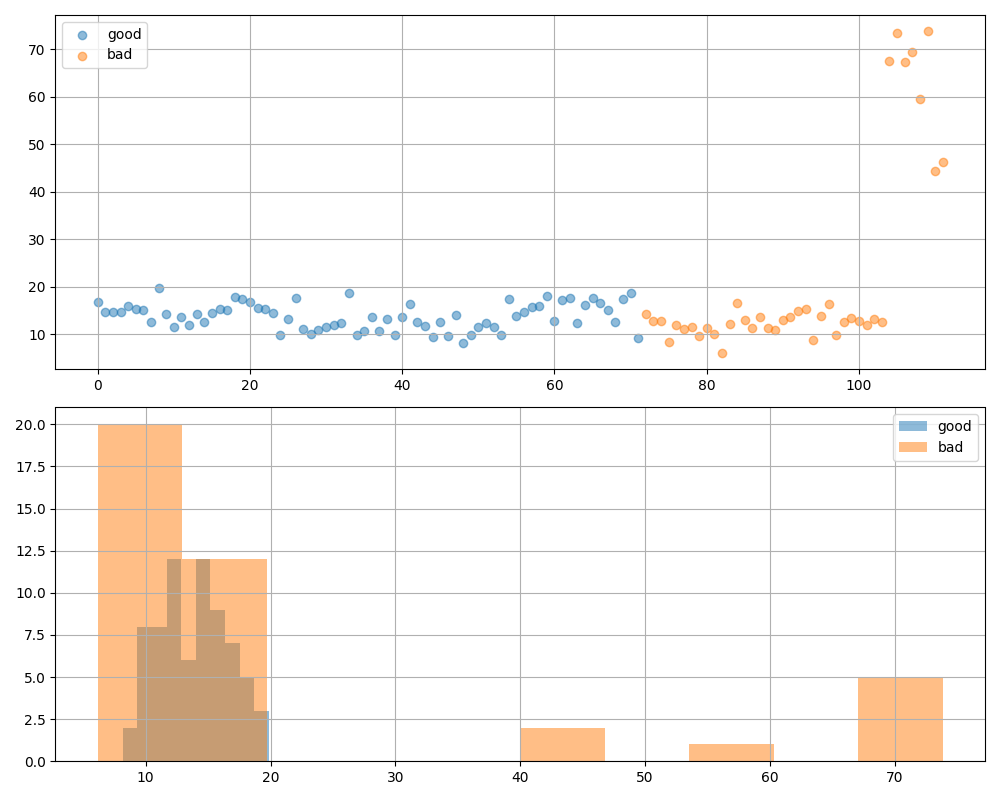
For example, the following is the predicted distribution of MVTec bottle, and in this case it seems appropriate to set a threshold of 50 or less for the anomaly score.