G2Plot

G2Plot copied to clipboard
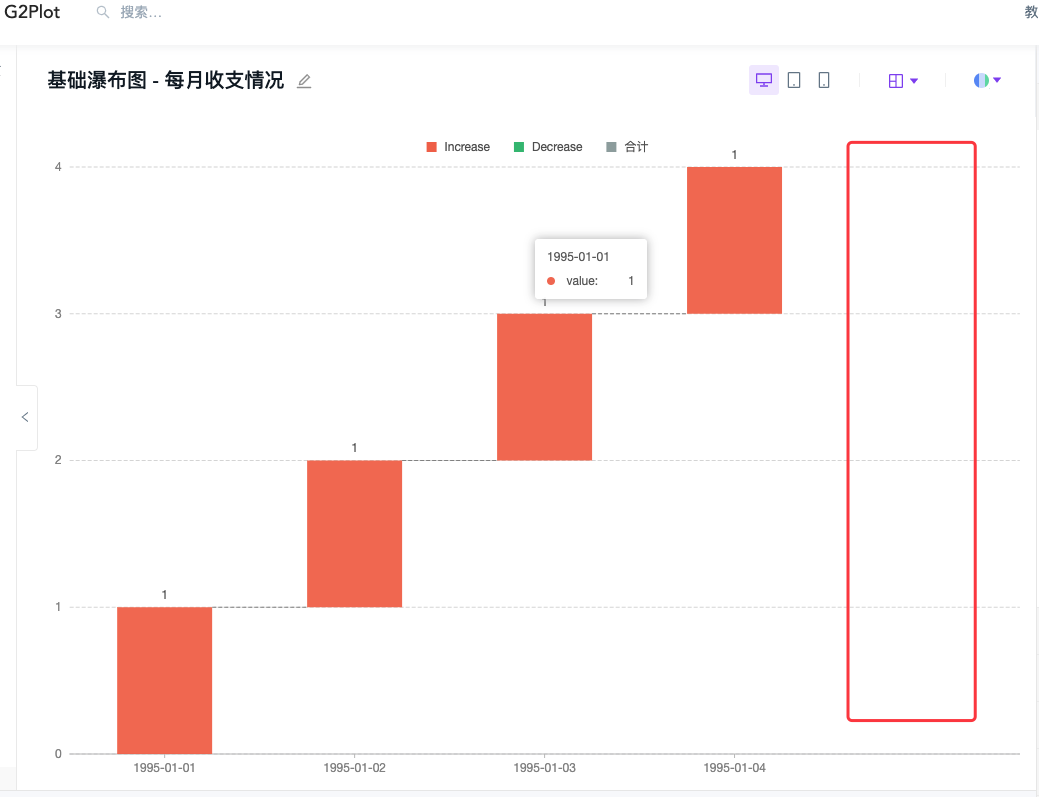
🐛 [BUG]瀑布图中,xField的值为日期格式,不显示total
🐛 Bug description [Please make everyone to understand it]
瀑布图中,xField的值为日期格式(yyyy-MM-dd),没有显示total柱子,但留出了total的区域(空白)
- Required Link to minimal reproduction:
📷 Step to reproduce
代码如下:
import { Waterfall } from '@antv/g2plot';

const data = [{
  "value": 1,
  "field": "1995-01-01"
},
{
  "value": 1,
  "field": "1995-01-02"
},
{
  "value": 1,
  "field": "1995-01-03"
},
 {
  "value": 1,
  "field": "1995-01-04"
}];

const waterfallPlot = new Waterfall('container', {
  data,
  xField: 'field',
  yField: 'value',
  total: {
    label: '合计',
    style: {
      fill: '#96a6a6',
    },
  },
});

waterfallPlot.render();
🏞 Expected result
希望能绘制出合计柱子
🚑 Any additional [like screenshots]
- G2Plot Version:2.4.9
- Platform:
@tzlaosiji @BBchicken-9527 内部会自动解析x 轴数据是否是时间类型的,从而自动把 meta[xField].type 变为 timeCat。 如果x坐标数据为 time 类型, 最标轴就加不上 total 字段。 你需要把 meta[xField].type 设置为 cat 才行。