How to extract network (in cnetplot + emapplot) for export?
Hi,
For further fine-tuning of the layout (because of overlapping nodes/labels) I would like to export the underlying networks generated by the cnetplot and emapplot functions for further processing in (e.g.) Cytoscape.
-
I know that I can send
igraphobjects directly to Cytoscape using theRCy3package. [Alternatively, the network could be exported as *.gml or *.graphml file]. -
From studying the relevant source codes I also know that under the hood first
igraphobjects are generated that are then 'further processed' within the functions (e.g. source code from cnetplot). Generation of the networks asigraphobject: https://github.com/YuLab-SMU/enrichplot/blob/e2c76422a58b01637065e4b6f98e017ae690041a/R/cnetplot.R#L233 Example of further processing: https://github.com/YuLab-SMU/enrichplot/blob/e2c76422a58b01637065e4b6f98e017ae690041a/R/cnetplot.R#L240
So my question is if it currently is somehow possible to extract the "final" igraph object g from the output from the cnetplot and emapplot functions?
If so, how to do this?
If not, allow me then to submit a feature request; the (optional) addition of the igraph object g to the output from the cnetplot and emapplot functions (such as p below).
Thanks! G
> library(clusterProfiler)
> library(enrichplot)
> library(DOSE)
>
> data(geneList)
> de <- names(geneList)[abs(geneList) > 2]
>
> edo <- enrichDGN(de)
>
> edox <- setReadable(edo, 'org.Hs.eg.db', 'ENTREZID')
>
> p <- cnetplot(edox, color.params = list(foldChange = geneList) )
Scale for size is already present.
Adding another scale for size, which will replace the existing scale.
>
> attributes(p)
$names
 [1] "data"        "layers"      "scales"      "mapping"     "theme"
 [6] "coordinates" "facet"       "plot_env"    "labels"      "guides"

$class
[1] "ggraph" "gg"     "ggplot"

>
labels do overlap....

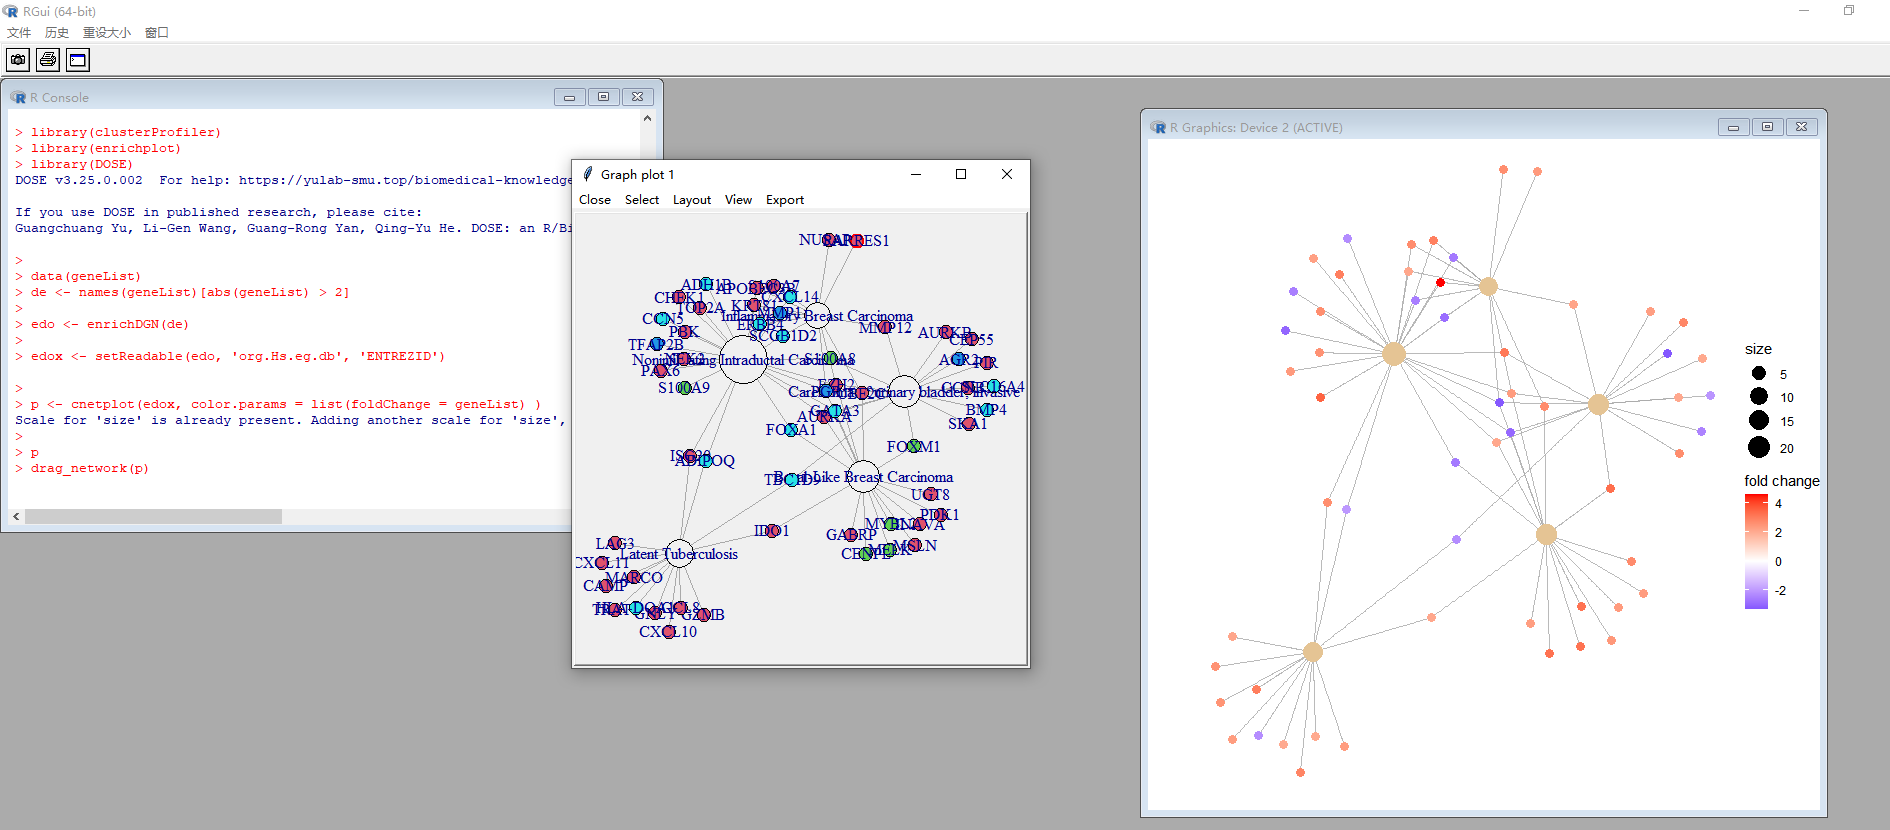
@huerqiang: thanks a lot for pointing me to drag_network()!
I played a bit with it, and calling drag_network() indeed allows to change the layout of the network within R.
Unfortunately, in the end I was not able to obtain the result I was aiming for: after changing the layout of the network I noticed that the names/labels of the nodes disappeared from the network, See below for code and graphs. This is also visible in your screenshot (in the active graphics device window on the right).
I don't know what is causing this behavior, but I don't think this is related to enrichplot as such, but rather to how R deals with updating its graphics (when multiple layers are present?).
I therefore spent some time figuring out on how to export such network to Cytoscape, and I indeed got it working along the line of thoughts I wrote in my first post of this thread. See the next post for all those details/code.
Code showing that the names of the nodes disappear after modifying the network with drag_network().
> library(enrichplot)
> library(DOSE)
>
> ## load sample data, and set the DEGs
> data(geneList)
> de <- names(geneList)[abs(geneList) > 2]
>
> ## perform enrichment analysis of the DEGs
> edo <- enrichDGN(de)
>
> ## convert entrez ids into gene symbols
> edox <- setReadable(edo, 'org.Hs.eg.db', 'ENTREZID')

>
> ## generate gene-concept network, and store in 'p'
> p <- cnetplot(edox, color.params = list(foldChange = geneList) )
Scale for size is already present.
Adding another scale for size, which will replace the existing scale.
>
> ## save original network
> library(ggplot2)
> ggsave(filename = "original.layout.cnetplot.pdf")
Saving 7 x 7 in image
> ## modify network
> drag_network(p)
There were 36 warnings (use warnings() to see them)
>
> ## save modified network
> ggsave(filename = "changed.layout.cnetplot.pdf")
Saving 7 x 6.99 in image
Warning message:
ggrepel: 62 unlabeled data points (too many overlaps). Consider increasing max.overlaps
>
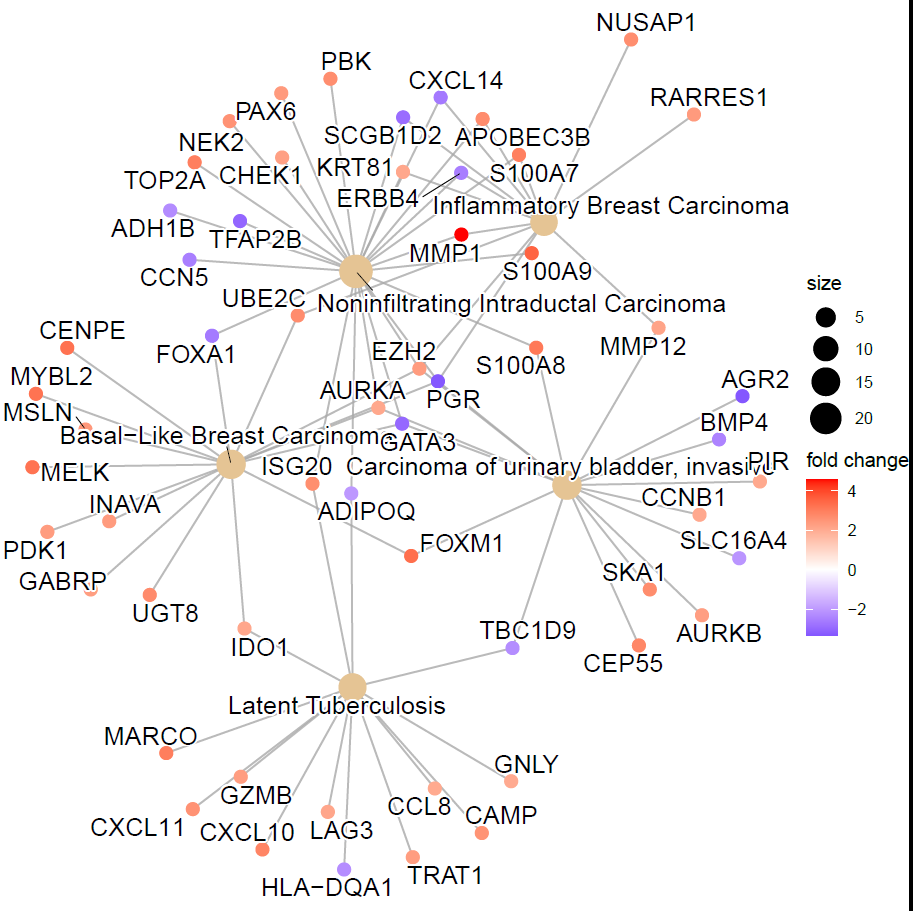
Network with original layout that includes the labels:
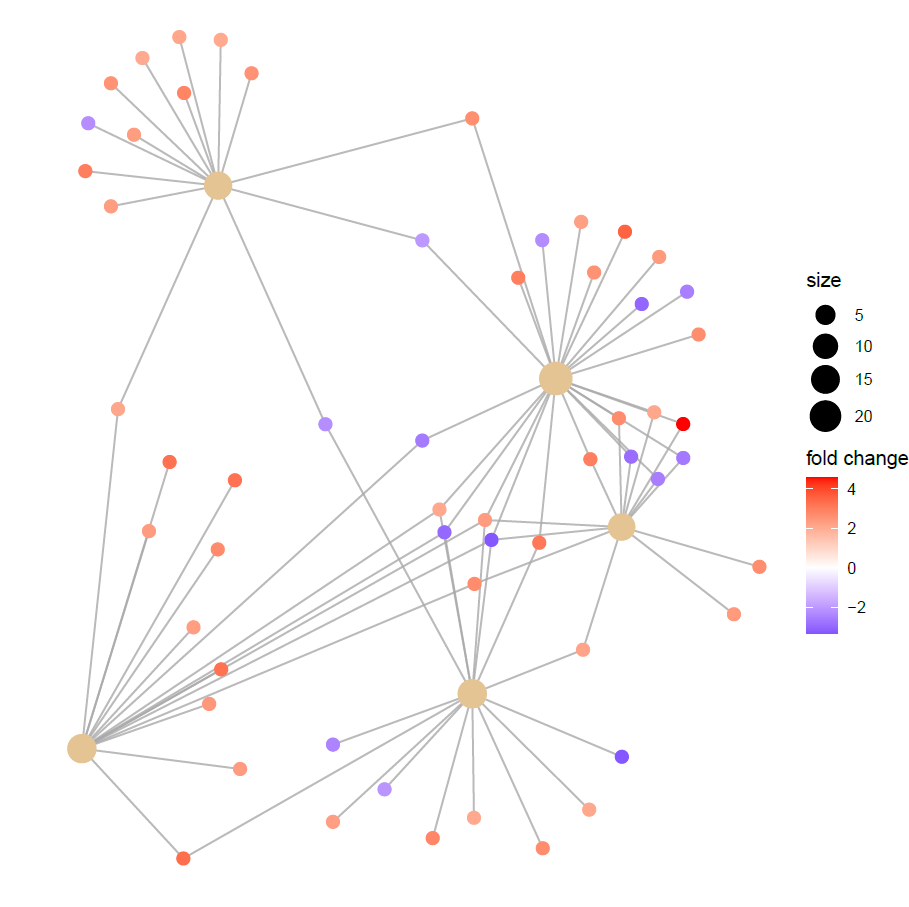
Network after modifying the layout: the labels disappeared....
Below find the code that I used to export the network to Cytoscape.
The key is to extract all network information from the object p that is generated in the code above as output from the function cnetplot, convert the information on the nodes and edges into 2 separate data.frames, and then use these data.frames to sent a network to Cytoscape using the RCy3 package. I used this with Cytoscape version 3.9.1.
Also good to mention that these 2 threads at StackOverflow put me on the right track: https://stackoverflow.com/questions/70497768/how-to-go-from-a-ggraph-object-to-an-igraph-object-r https://stackoverflow.com/questions/63997659/get-edge-data-from-the-tidygraph-package
Code + some explanations:
> ## Part 1: generation of gene-concept network
>
> ## load required libraries
>
> library(clusterProfiler)
> library(enrichplot)
> library(DOSE)
>
> ## load sample data, and set some DEGs
> data(geneList)
> de <- names(geneList)[abs(geneList) > 2]
>
> ## perform enrichment analysis of the DEGs
> edo <- enrichDGN(de)
>
> ## convert entrez ids into gene symbols
> edox <- setReadable(edo, 'org.Hs.eg.db', 'ENTREZID')
>
> ## generate gene-concept network, and store in 'p'
> p <- cnetplot(edox, color.params = list(foldChange = geneList) )
Scale for size is already present.
Adding another scale for size, which will replace the existing scale.
>
>
> ## Part 2: prepare data.frames from the gene-concept network for export to Cytoscape
>
>
> ## load required libraries
> library(dplyr)
> library(tidygraph)
> library(tibble)
>
> ## access attributes of p
> attributes(p)
$names
[1] "data" "layers" "scales" "mapping" "theme"
[6] "coordinates" "facet" "plot_env" "labels" "guides"
$class
[1] "ggraph" "gg" "ggplot"
>
> ## extract all nodes and edges that form the network
> graph_info <- attributes(p$data)$graph
> graph_info
# A tbl_graph: 62 nodes and 83 edges
#
# An undirected simple graph with 1 component
#
# Edge Data: 83 × 4 (active)
from to alpha direction
<int> <int> <dbl> <fct>
1 1 6 0.8 left
2 1 7 0.8 left
3 1 8 0.8 left
4 1 9 0.8 right
5 1 10 0.8 left
6 1 11 0.8 left
# … with 77 more rows
#
# Node Data: 62 × 4
name size color .ggraph.orig_index
<chr> <dbl> <dbl> <int>
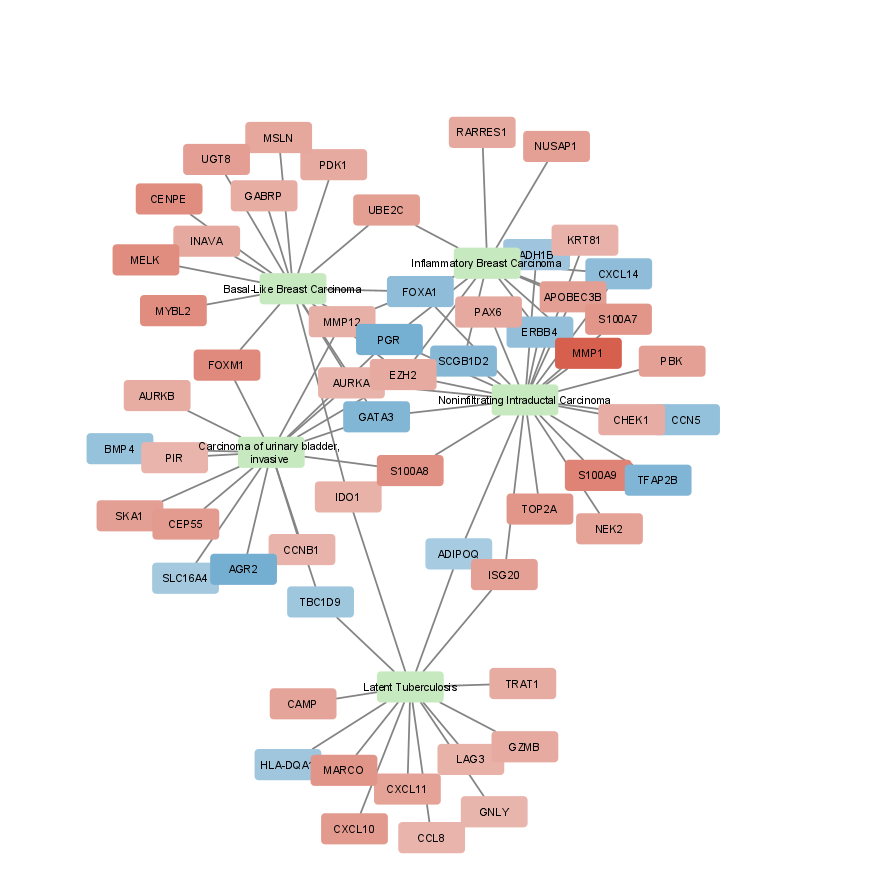
1 Noninfiltrating Intraductal Carcinoma 24 NA 1
2 Basal-Like Breast Carcinoma 16 NA 2
3 Latent Tuberculosis 14 NA 3
# … with 59 more rows
>
>
>
> ## extract all nodes from network, convert into a data.frame, rename column named 'name' to 'id'
> ## (because function createNetworkFromDataFrames() requires this label), and finally
> ## replace NA values for color (= for concepts) into 0, so that Cytoscape imports
> ## values in this column as type 'double', and not as 'string'. In case of type 'string'
> ## the 'Mapping Type' = 'Continuous Mapping' is not available in Cytoscape!
> graph_nodes <-
+ graph_info %>%
+ activate(nodes) %>%
+ data.frame() %>%
+ rownames_to_column("rowid") %>% # in essence this step is not required, but is included for convenience
+ mutate(rowid = as.integer(rowid)) %>% # in essence this step is not required, but is included for convenience
+ rename(id=name) %>% # rename column named 'name' to 'id'
+ mutate(color = ifelse(is.na(color), 0, color)) # replace NA values with zero in column named color
>
> graph_nodes[1:8,]
rowid id size color .ggraph.orig_index
1 1 Noninfiltrating Intraductal Carcinoma 24.0 0.000000 1
2 2 Basal-Like Breast Carcinoma 16.0 0.000000 2
3 3 Latent Tuberculosis 14.0 0.000000 3
4 4 Carcinoma of urinary bladder, invasive 16.0 0.000000 4
5 5 Inflammatory Breast Carcinoma 13.0 0.000000 5
6 6 MMP1 6.5 4.572613 6
7 7 S100A9 6.5 3.501963 7
8 8 S100A8 6.5 3.086836 8
>
> ## extract all edges from network, convert into a data.frame, rename column names 'from' and 'to'
> ## to 'source' resp. 'target'(because function createNetworkFromDataFrames() requires these labels).
> graph_edges <-
+ graph_info %>%
+ activate(edges) %>%
+ data.frame() %>%
+ rename(source=from, target=to)
>
> graph_edges[1:8, ]
source target alpha direction
1 1 6 0.8 left
2 1 7 0.8 left
3 1 8 0.8 left
4 1 9 0.8 right
5 1 10 0.8 left
6 1 11 0.8 left
7 1 12 0.8 right
8 1 13 0.8 right
>
> ## In the data.frame 'graph_edges' the nodes are referred to as a number, but since
> ## the nodes in the nodes table are identified by their description ('name'), this has to be changed!
> ## This is done in the code chunk below that generates the object 'graph_named_edges'.
> graph_named_edges <-
+ graph_info %>%
+ activate(edges) %>%
+ mutate(to_name = .N()$name[to],
+ from_name = .N()$name[from]) %>%
+ as_tibble() %>%
+ select(source = from_name, target = to_name, direction) %>%
+ data.frame()
>
> graph_named_edges[1:8, ]
source target direction
1 Noninfiltrating Intraductal Carcinoma MMP1 left
2 Noninfiltrating Intraductal Carcinoma S100A9 left
3 Noninfiltrating Intraductal Carcinoma S100A8 left
4 Noninfiltrating Intraductal Carcinoma TOP2A right
5 Noninfiltrating Intraductal Carcinoma S100A7 left
6 Noninfiltrating Intraductal Carcinoma APOBEC3B left
7 Noninfiltrating Intraductal Carcinoma PBK right
8 Noninfiltrating Intraductal Carcinoma ISG20 right
>
>
> ## Part 3: import data.frames as network into Cytoscape
> ## Note: be sure to have Cytoscape running before executing the code!
>
> ## load required library
> library(RCy3)
>
> ## Test the connection to Cytoscape
> cytoscapePing()
You are connected to Cytoscape!
>
> ## Export network into Cytoscape
> createNetworkFromDataFrames(nodes = graph_nodes, edges = graph_named_edges, title = "cnetplot")
Loading data...
Applying default style...
Applying preferred layout...
networkSUID
124
>
> ## Continue in Cytoscape!
Part 4: first fine-tuning of netwerk in Cytoscape
-- For visualizing fold changes of genes: in Cytoscape: Style > Node > Fill Color: Column = color, Mapping type = Continuous Mapping
-- Color the boxes of the concepts green: In Cytoscape: First: manually select (mouse-click) in the network the 5 boxes with the names of the concepts. Then: Style > Node > Fill Color: click the box 'Byp.' (bypass), and pick your favorite color (in my case green).
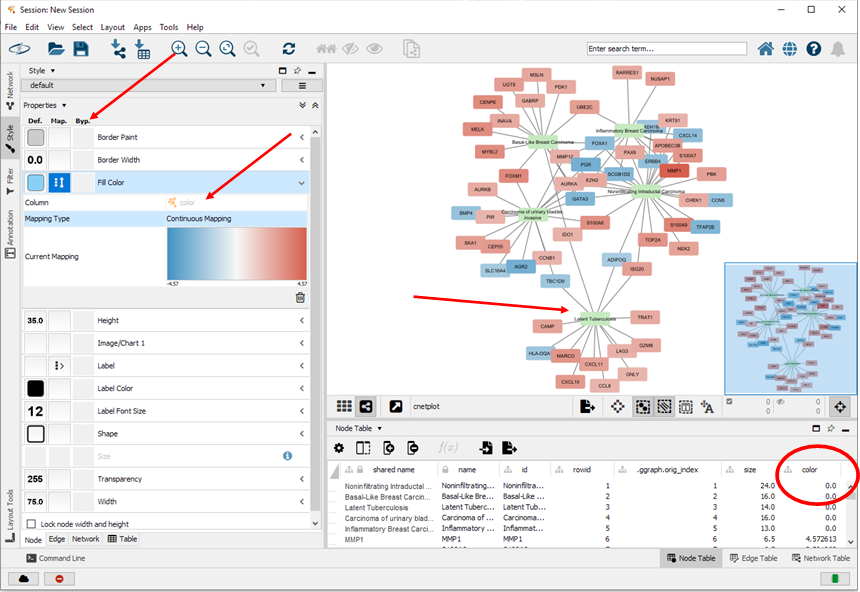
First intermediary version of the network (that should be further optimized):
Hi,
I have been trying your suggestion of exporting the cnetplot for Cytoscape but after the following step the graph_info object returns NULL.
graph_info <- attributes(p$data)$graph graph_info NULL
I searched for the reason and found out that in newer versions (e.g. enrichplot ≥1.20), cnetplot() no longer attaches the graph object to p$data. Can you please guide me through a way around this problem?
Looking forward to hearing from you. Thanks in advance.
Abeedha