Treeplot: possible to add border color around tippoints for a feature/column in enrichResult?
Trying to add a fill as test to the enrichplot:::group_tree() code below doesn't seem to work:
if (add_tippoint) {
    print(color)
    p <- p + ggnewscale::new_scale_colour() +
      geom_tippoint(aes(color = color, size = count, fill = color )) +
      scale_colour_continuous(low="red", high="blue", name = color,
                              guide = guide_colorbar(reverse = TRUE))
Any other possibilities I could look into otherwise?
Please provide repeatable code and point out how the actual result is different from the expected result.
Hi and thanks for your response again @huerqiang, I'm unsure of how to make a quick reproducible example code-wise, but I can at least show what I want.
I've been able to add an additional row of dots with labels to plot more features simultaneously.
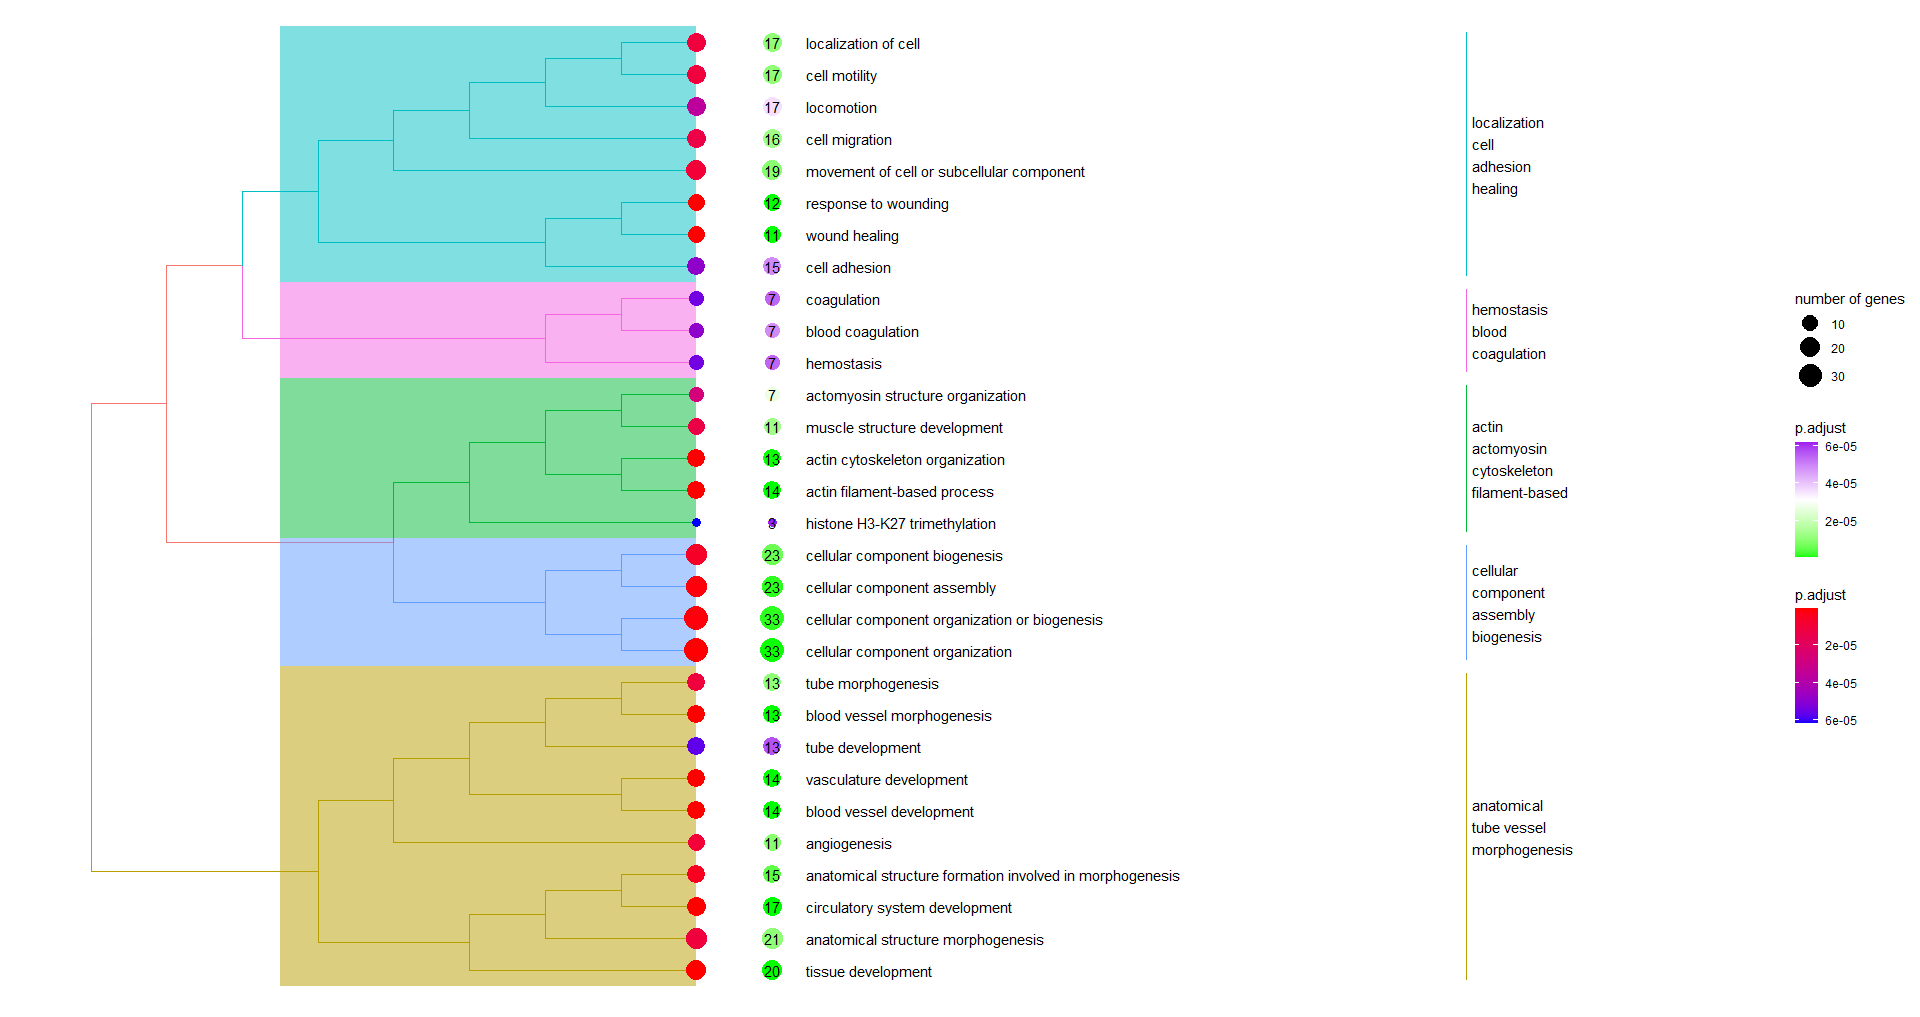
Now what I would like as a fill (border) color for the dots, as manually added here for the left row top 3 dots:

If needed I will look into how to make a reprex later.