emapplot generate different plot using the same data
Hi,
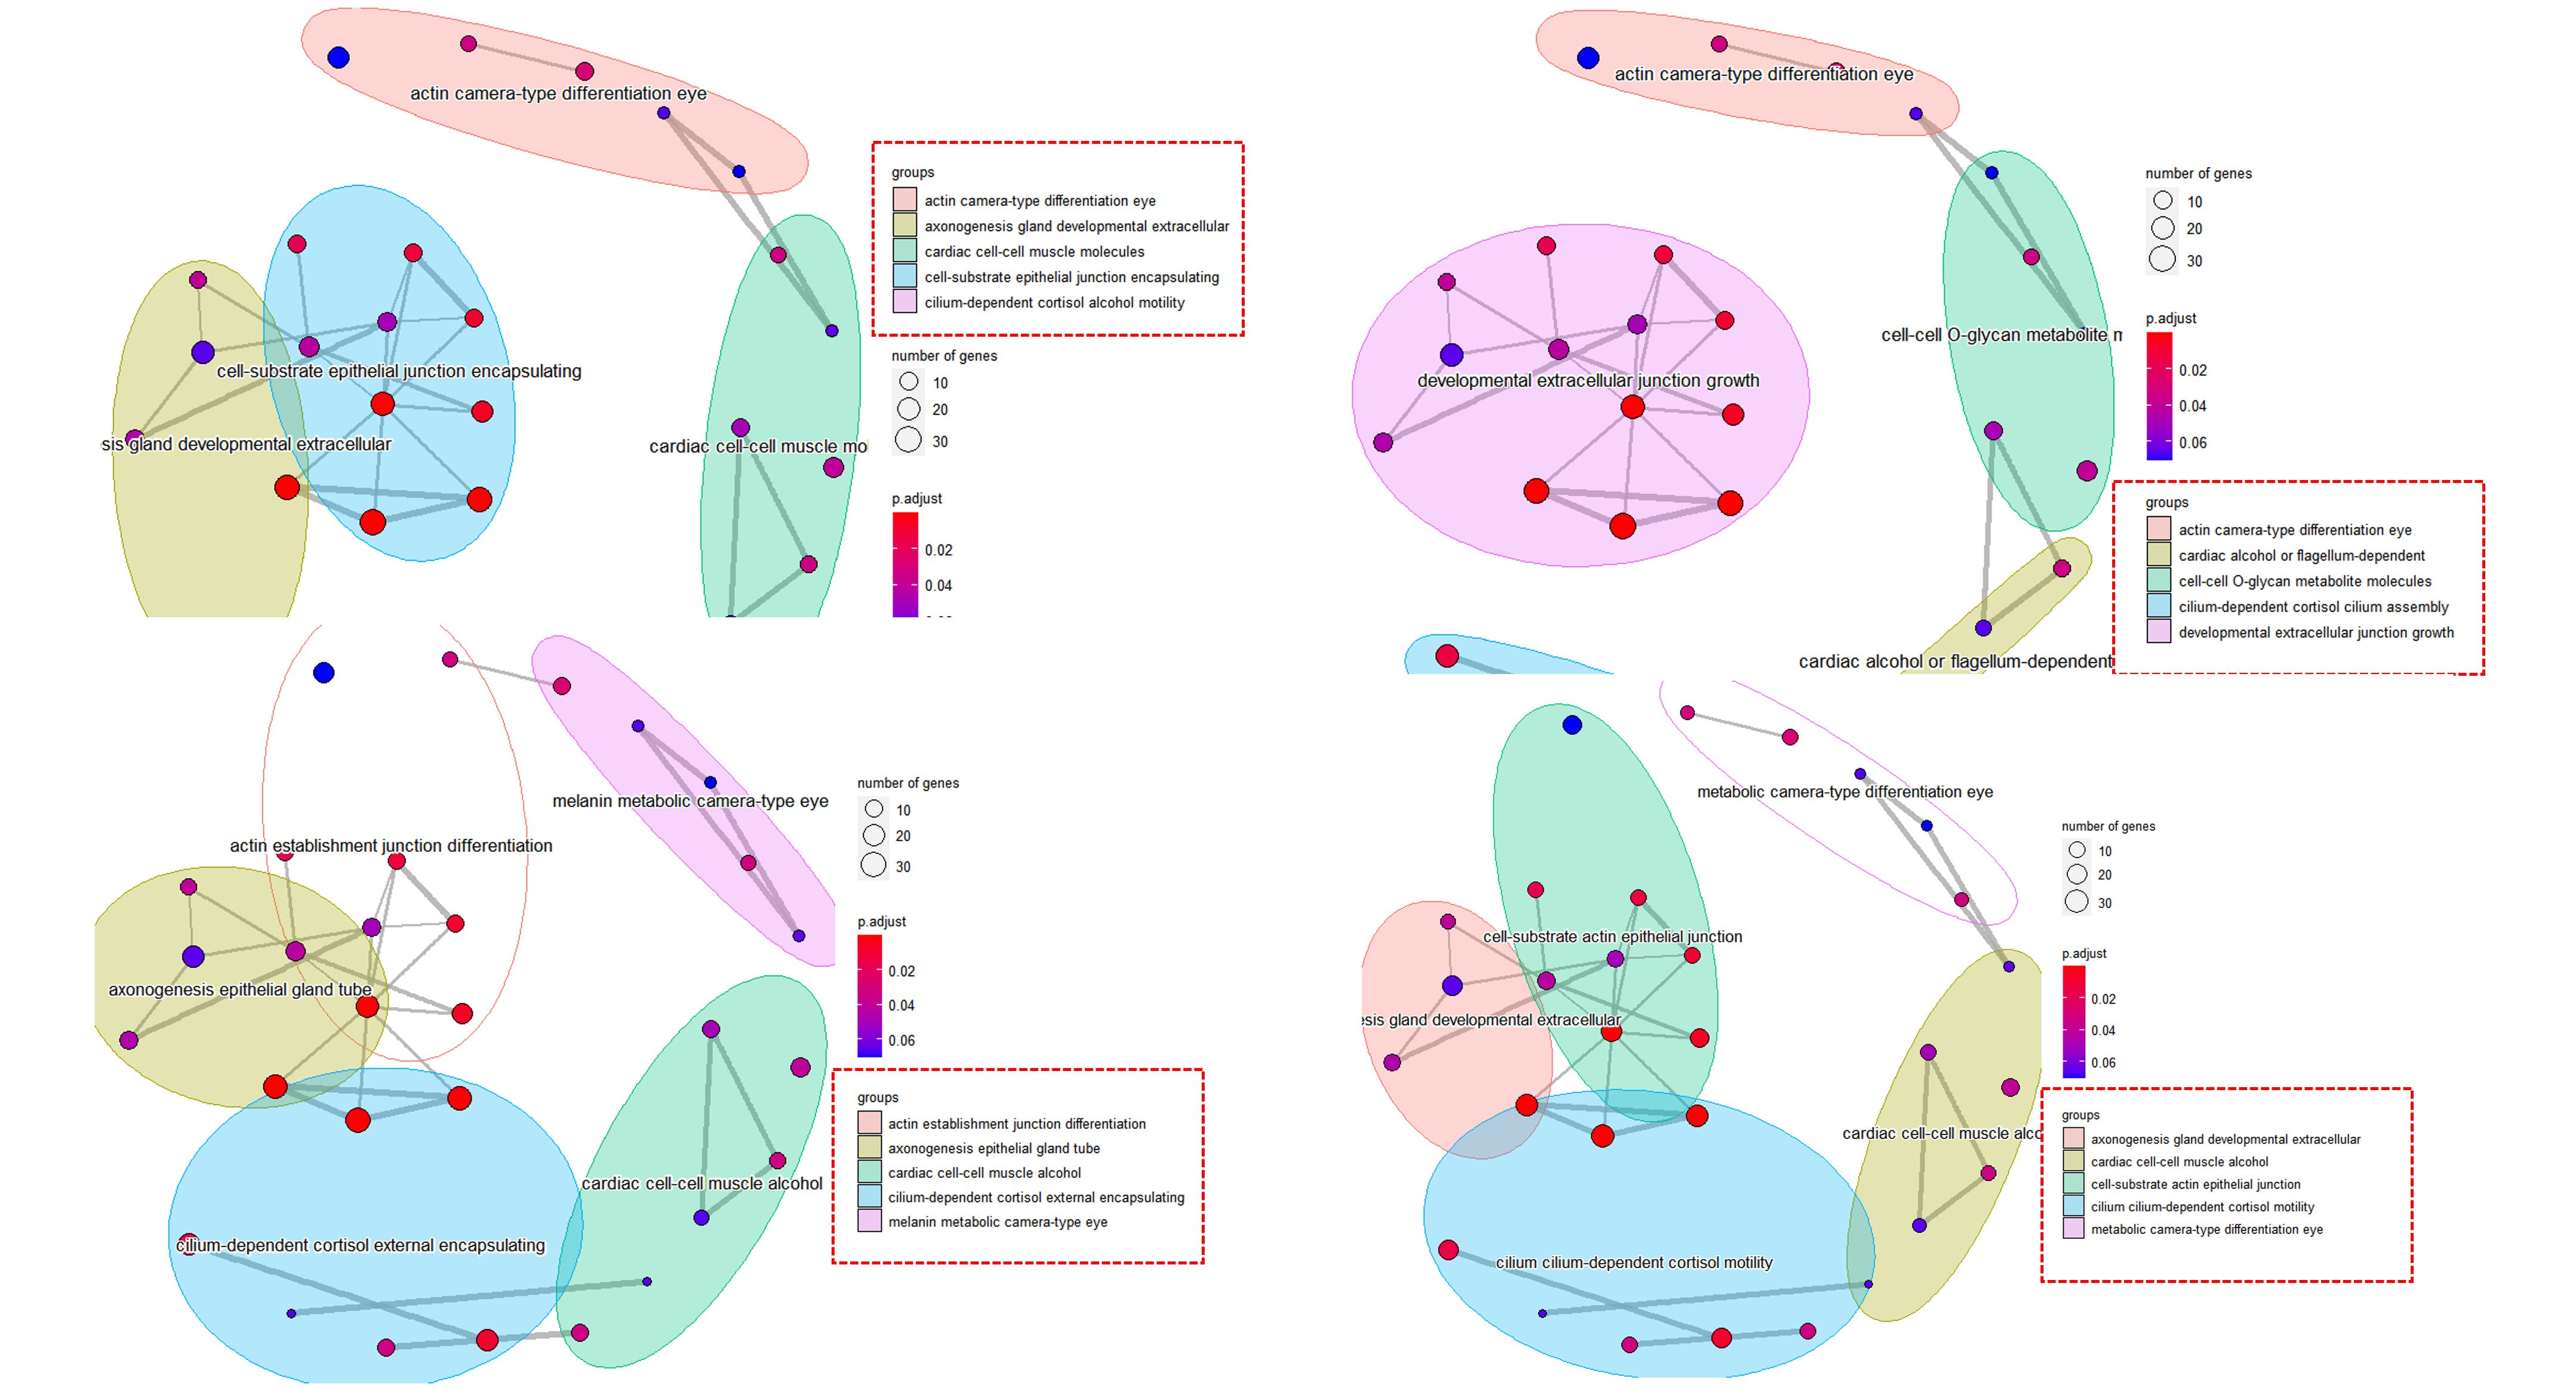
I am using clusterProfiler v4.0.2 now and I found I could not generate the same plot (by group) using "emapplot".
my code is
emapplot(spf, layout="kk", group_category = T, group_legend = T, cex_label_group = 1.5, node_label = "group", nCluster = 5)
then I tried to run this code several times, it will generate different plots every time, with different groups.
I put a figure below generated from 4 times using the same code and same dataset.
Are there any solutions to make it more consistent? Thanks!
You can use this code to make the results consistent every time:
# It is also correct to use other seed values
set.seed(123)
Thanks.
I have tried set.seed() already, but it doesn't work, still generates different group results.
Use the same seed before each plot, not just before the first plot:
library(DOSE)
data(geneList)
de <- names(geneList)[1:100]
x <- enrichDO(de)
x2 <- pairwise_termsim(x)
set.seed(123)
p1 <- emapplot(x2, layout="kk", group_category = T, group_legend = T,
    cex_label_group = 1.5, node_label = "group", nCluster = 5)
set.seed(123)
p2 <- emapplot(x2, layout="kk", group_category = T, group_legend = T,
    cex_label_group = 1.5, node_label = "group", nCluster = 5)
set.seed(123)
p3 <- emapplot(x2, layout="kk", group_category = T, group_legend = T,
    cex_label_group = 1.5, node_label = "group", nCluster = 5)
set.seed(123)
p4 <- emapplot(x2, layout="kk", group_category = T, group_legend = T,
    cex_label_group = 1.5, node_label = "group", nCluster = 5)
library(cowplot)
plot_grid(p1, p2, p3, p4)
Hi I was wondering how you got your GO terms to be grouped like that? I realized I have multiple GO terms with similar sets of genes and I don't want to repeat multiple of the same things.
Similar(Semantic similarity or other calculation methods) GO terms are grouped together using K-means.
I am not quite sure what that means? How do use the enrichGO data that is generate to get this?