Weird Rarecurve
library(MicrobiotaProcess) library(ggplot2) library(phyloseq) rm(list=ls()) options(stringsAsFactors = F) setwd("C:/Users/lishu/Desktop/ARG/stin/3.1.1/") getwd() otu <- read.delim('稀释.type.txt', row.names = 1, sep = '\t', stringsAsFactors = FALSE, check.names = FALSE) otu1<-as.data.frame(otu) otu1 <- t(otu1) sd <- read.delim('.type.txt', row.names = 1,sep = '\t', stringsAsFactors = FALSE, check.names = FALSE) sd1<-as.data.frame(sd) otu1[is.na(otu1)]<-0 otu1<-ceiling(otu1) sample_data(sd) test_otu_data2<-phyloseq(otu_table(otu1,taxa_are_rows =T), sample_data(sd)) set.seed(1000) p1 <- ggrarecurve(test_otu_data2, indexNames=c("Chao1","ACE"), chunks=10) + guides(color=guide_legend(keywidth=0.5, keyheight=0.5))+ theme(legend.spacing.y=unit(0.02,"cm"), legend.text=element_text(size=6)) p1 and my rarecurve is upside down.

Hello, which version MicrobiotaProcess are you using? The MicrobiotaProcess has been updated. I recommend using the mp_cal_rarecurve and mp_plot_rarecurve to perform the analysis. You can use as.MPSE to convert the phyloseq to MPSE class, then refer to the following codes to perform it. and you can refer to the issue.
> library(MicrobiotaProcess)
MicrobiotaProcess v1.9.1.990 For help:
https://github.com/YuLab-SMU/MicrobiotaProcess/issues
If you use MicrobiotaProcess in published research, please cite the
paper:
S Xu, L Zhan, W Tang, Z Dai, L Zhou, T Feng, M Chen, S Liu, X Fu, T Wu,
E Hu, G Yu. MicrobiotaProcess: A comprehensive R package for managing
and analyzing microbiome and other ecological data within the tidy
framework. 04 February 2022, PREPRINT (Version 1) available at Research
Square [https://doi.org/10.21203/rs.3.rs-1284357/v1]
This message can be suppressed by:
suppressPackageStartupMessages(library(MicrobiotaProcess))
> data(mouse.time.mpse)
> mouse.time.mpse
# A MPSE-tibble (MPSE object) abstraction: 4,142 × 11
# OTU=218 | Samples=19 | Assays=Abundance | Taxonomy=Kingdom, Phylum, Class, Order, Family, Genus, Species
OTU Sample Abundance time Kingdom Phylum Class Order Family Genus Species
<chr> <chr> <int> <chr> <chr> <chr> <chr> <chr> <chr> <chr> <chr>
1 OTU_1 F3D0 579 Early k__Bac… p__Ba… c__B… o__B… f__Mu… g__u… s__un_…
2 OTU_2 F3D0 345 Early k__Bac… p__Ba… c__B… o__B… f__Mu… g__u… s__un_…
3 OTU_3 F3D0 449 Early k__Bac… p__Ba… c__B… o__B… f__Mu… g__u… s__un_…
4 OTU_4 F3D0 430 Early k__Bac… p__Ba… c__B… o__B… f__Mu… g__u… s__un_…
5 OTU_5 F3D0 154 Early k__Bac… p__Ba… c__B… o__B… f__Ba… g__B… s__un_…
6 OTU_6 F3D0 470 Early k__Bac… p__Ba… c__B… o__B… f__Mu… g__u… s__un_…
7 OTU_7 F3D0 282 Early k__Bac… p__Ba… c__B… o__B… f__Mu… g__u… s__un_…
8 OTU_8 F3D0 184 Early k__Bac… p__Ba… c__B… o__B… f__Ri… g__A… s__un_…
9 OTU_9 F3D0 45 Early k__Bac… p__Ba… c__B… o__B… f__Mu… g__u… s__un_…
10 OTU_10 F3D0 158 Early k__Bac… p__Ba… c__B… o__B… f__Mu… g__u… s__un_…
# … with 4,132 more rows
> mouse.time.mpse %<>% mp_rrarefy() %>% mp_cal_rarecurve(.abundance=RareAbundance, chunks=400)
> mouse.time.mpse %>% mp_extract_sample
# A tibble: 19 × 3
Sample time RareAbundanceRarecurve
<chr> <chr> <list>
1 F3D0 Early <tibble [2,520 × 4]>
2 F3D1 Early <tibble [2,520 × 4]>
3 F3D141 Late <tibble [2,520 × 4]>
4 F3D142 Late <tibble [2,520 × 4]>
5 F3D143 Late <tibble [2,520 × 4]>
6 F3D144 Late <tibble [2,520 × 4]>
7 F3D145 Late <tibble [2,520 × 4]>
8 F3D146 Late <tibble [2,520 × 4]>
9 F3D147 Late <tibble [2,520 × 4]>
10 F3D148 Late <tibble [2,520 × 4]>
11 F3D149 Late <tibble [2,520 × 4]>
12 F3D150 Late <tibble [2,520 × 4]>
13 F3D2 Early <tibble [2,520 × 4]>
14 F3D3 Early <tibble [2,520 × 4]>
15 F3D5 Early <tibble [2,520 × 4]>
16 F3D6 Early <tibble [2,520 × 4]>
17 F3D7 Early <tibble [2,520 × 4]>
18 F3D8 Early <tibble [2,520 × 4]>
19 F3D9 Early <tibble [2,520 × 4]>
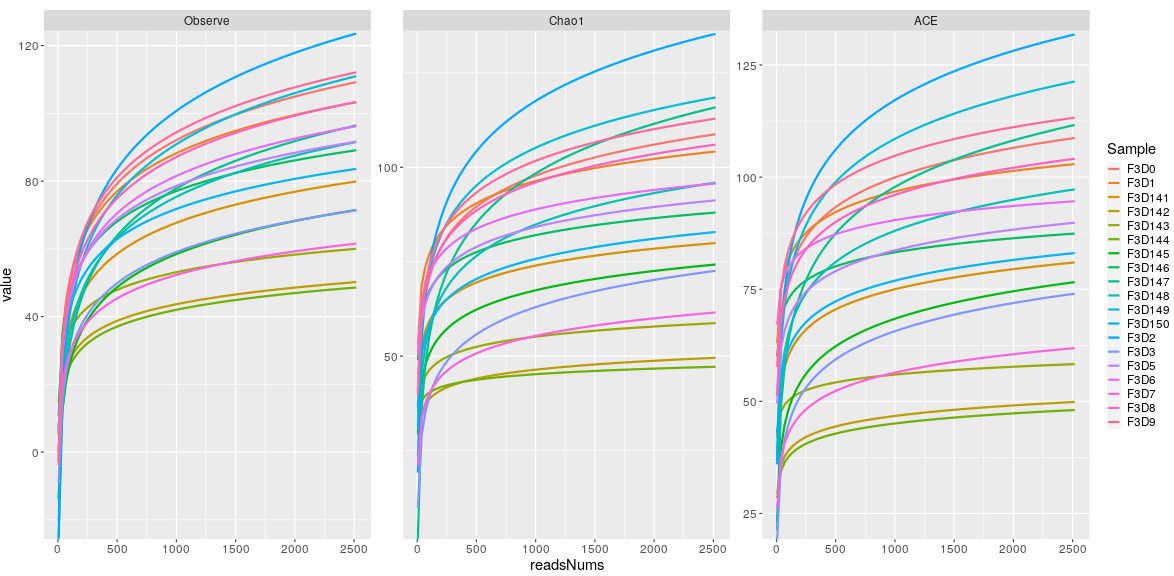
> mouse.time.mpse %>% mp_plot_rarecurve(.rare=RareAbundanceRarecurve,se=F) -> p1
> p1
In addition, I can not reproduce the issue, would you mind uploading the data set?
you can use saveRDS(your_phyloseq, 'obj.ps') to save the phyloseq object.