Add tephigram
Would be another useful plot to include alongside Skew-T. From a support email:
Wanted:
My data will be plotted in temperature, potential temperature pairs in a coordinate system rotated by -45 degrees. My plot axis will be in the original unrotated coordinate system so I still have a rectangular plot and the axis coordinates will be linked by a transformation to the data coordinates so that labelling the axis would be a simple case of performing this transformation on the data coordinates of the label and this would put the label in the correct place on the axis coordinates.
Problem:
I can easily rotate the data coordinates -45 degrees, however I’m struggling to find a way to keep the axis in the original coordinate system and link them to the correct data points. In the Skew-T example, the axis and ticks have all been adjusted separately - I feel like this should be easier in a tephigram as the x and y axis are still perpendicular. I do not know whether what I have described above is actually possible or not - perhaps you could advise!
Hmm - I thought I had already made an issue for tephigrams. While we're at it - the Stüve is an obvious addition as well.
Yeah. I looked, but couldn't find anything. Was trying to clean something out of the inbox, since it's been there since last fall.
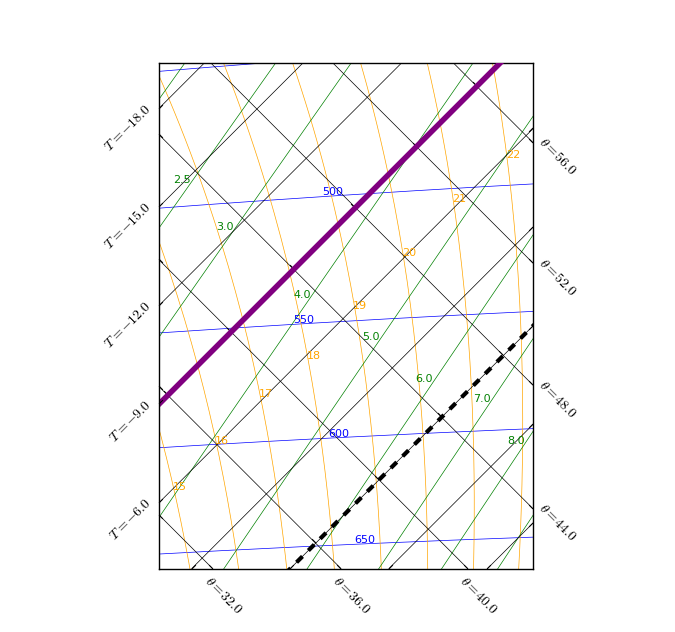
I am not sure whether this issue can be reopened but if it can be I am wanting to see tephigrams where potential temperature is the y -axis as shown in this image - https://ibb.co/zZNjh5X
@winash12 This issues isn't closed--closed above refers to #613.
Also, I'm not sure that image is a tephigram. On that image, isotherms are vertical and lines of constant potential temperature are horizontal. On every other one I can find, isotherms go up and to the right, and lines of constant potential temperature to up and to the left.
@dopplershift http://www.met.reading.ac.uk/~sgs02rpa/TEACHING/Tephigram.pdf
According to that link
The principal axes of a tephigram are temperature and potential temperature; these are straight and perpendicular to each other, but rotated through about 45º anticlockwise so that lines of constant temperature run from bottom left to top right on the diagram. This rotation makes lines of constant pressure almost horizontal, though gently curving down towards bottom left, so that altitude increases from bottom to top of the diagram.
Awesome work and big fan of MetPy in general, quick question though : After #1731 and a part from interest to implement Tephigram plots to MetPy, what is missing to add them as an official plot or perhaps as some configuration of SkewT plots (as I understand it it is a matter of rotating the axes)? I am looking to see if I can perhaps help or contribute but am lost in the thread.
@itsgifnotjiff It's more than just a rotation. The plot fundamentally plots T vs. theta (potential temperature), both rotated 45 degrees. The rotation is handled pretty straightforward with Matplotlib's transform, but we need to decide, for purposes of our plotting with matplotlib: what are the inputs? What are we considering the y-axis? p? Theta?
I would expect this to end up as a new class similar to SkewT, but with some difference transforms and special lines.
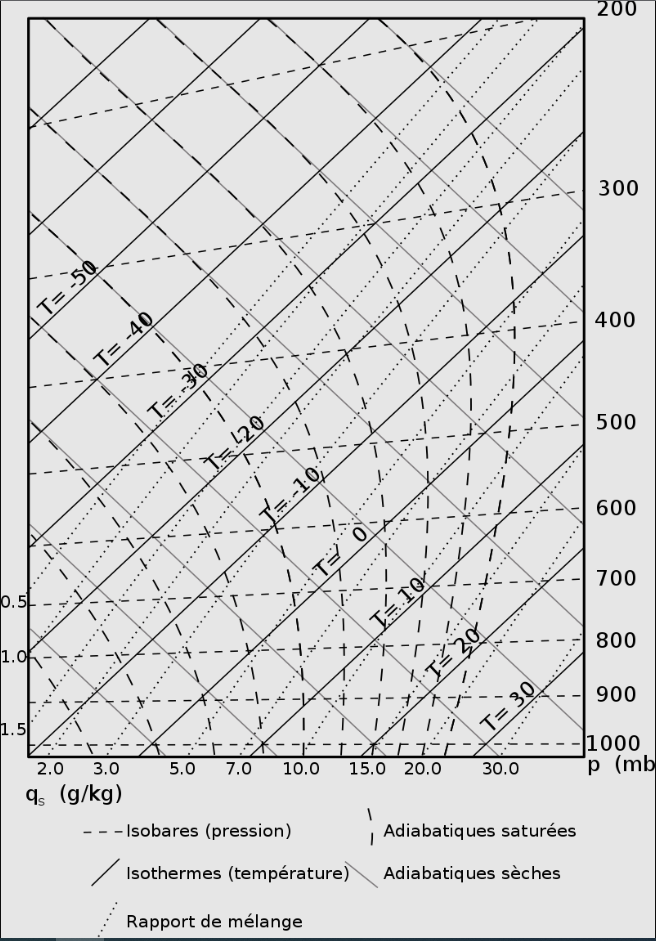
I asked a colleague of mine to send me a valid tephigram and he sent me this "template" with no data on it. The legend says (left to right, top to bottom) Isobars (pressure), Saturated Adiabatic, Isothermes (temperature), Dry Adiabatic, Mixing Ratio. On another note would it be very hard to implement the option to plot different values along the axis, give the option to specify what the Y-Axis is?
I think the easiest way to implement this is to always plot (T, Theta), maybe have plot(p, T) do the conversion, and draw all the other lines (isobars, adiabats, etc.) manually like we do in SkewT. Labelling shouldn't be too hard IMO. But I think having the transform be "just" the 45 rotation will be the most straightforward, though I bet there's still a lot of matplotlib weirdness, just like there is in SkewT.
Thank you for your work Mr. @dopplershift . Does this mean that you will let users "adapt" a MetPy SkewT in such a way (in which case I would love to collaborate on an example for the public documentation) and if not are there plans for it it be added to MetPy alongside SkewT?
I'd love to see this added to MetPy alongside SkewT. Right now it's not in our near term plans, but I'd love to review a community contributed Pull Request that adds it.