Order blocks and support/resistance indicators
I would like to request the addition of order blocks and support/resistance indicators. I've searched around and found nothing relevant, and I have tried looking into coding my own, but I guess the site/project uses javascript, and besides my not understanding that language very well, I don't see how it could even be done (seems like it would need new API calls, not sure).
I currently have to keep a tab open to tradingview.com just for these two indicators, and I'd prefer not to have to rely on them. It's redundant, they're a commercial entity that are constantly pushing their paid services, the site limits how many indicators you can enable, they're slow, and I don't have enough screen space to show both sites at the same time (I'd much prefer to keep aggr.trade shown, for its live/recent trades feed).
For reference, here's what my setup there looks like:
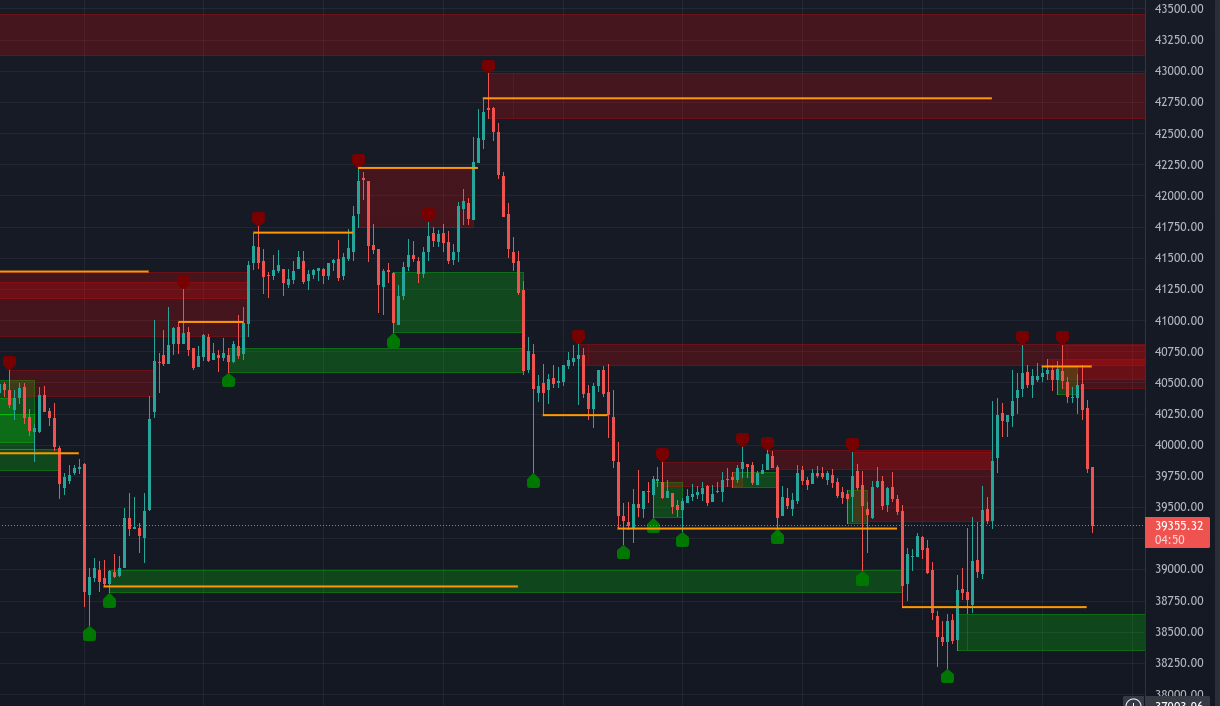
Shown here are "Order blocks" by pmk07 (with second-order pivots shown), and "Support/Resistance V2", by BarsStallone.
The source code for these indicators is publicly available under the MPL v2.0 license (for both), so I've shared them below, just for reference. I think TV calls the language "Pine".
Order Blocks
// This source code is subject to the terms of the Mozilla Public License 2.0 at https://mozilla.org/MPL/2.0/
// © pmk07
//
// Acknowledgements/Reference:
//
// @rumpypumpydumpy - Higher Order Pivots
// https://www.tradingview.com/v/x2LlRvBe/
//
// @MarkMiddleton2020 - Order Blocks
// https://www.tradingview.com/v/GecN34Qq/
//
//@version=5

indicator(title='Order Blocks', overlay=true)

string      bos_type        = input.string      ("High and Low",    title='MSB trigger',                            options=["High and Low", "Close and Open"])
bool        pv2_sv          = input.bool        (true,              title='Display 2nd order pivots')
bool        bos_sv          = input.bool        (true,              title='Highlight candles that broke structure')
bool        msb_sv          = input.bool        (true,              title='Plot market structure broke lines')
bool        box_sv          = input.bool        (true,              title='Plot demand boxes')
int         box_test_delay  = input.int         (3,                 title='Delay to count test of demand box')
int         box_fill_delay  = input.int         (3,                 title='Delay to count fill of demand box')
bool        box_test_sv     = input.bool        (true,              title='Dim tested demand boxes')
bool        box_stop_sv     = input.bool        (true,              title='Stop plotting filled demand boxes')

var float[] pvh1_price      = array.new_float   (1000, na)          // high
var int[]   pvh1_time       = array.new_int     (1000, na)
var float[] pvl1_price      = array.new_float   (1000, na)          // low
var int[]   pvl1_time       = array.new_int     (1000, na)

var float[] pvh2_price      = array.new_float   (1000, na)          // higher high
var int[]   pvh2_time       = array.new_int     (1000, na)
var float[] pvl2_price      = array.new_float   (1000, na)          // lower low
var int[]   pvl2_time       = array.new_int     (1000, na)

var float   htcmrll_price   = na                                    // high that created most recent ll
var int     htcmrll_time    = na
var float   ltcmrhh_price   = na                                    // low that created most recent hh
var int     ltcmrhh_time    = na

var box[]   long_boxes      = array.new_box()
var box[]   short_boxes     = array.new_box()
var box[]   oldlong_boxes   = array.new_box()
var box[]   oldshort_boxes  = array.new_box()

var line[]  bull_bos_lines  = array.new_line()
var line[]  bear_bos_lines  = array.new_line()

var label[] la_ph2          = array.new_label   (1000, na)
var label[] la_pl2          = array.new_label   (1000, na)

var float   temp_pv_0       = na
var float   temp_pv_1       = na
var float   temp_pv_2       = na

bool        pvh             = high < high[1] and high[1] > high[2]
bool        pvl             = low > low[1] and low[1] < low[2]

int         pv1_time        = bar_index[1]
float       pv1_high        = high[1]
float       pv1_low         = low[1]
float       trigger_high    = bos_type=="High and Low" ? high : math.max(open, close)
float       trigger_low     = bos_type=="High and Low" ? low : math.min(open, close)

bool        bos_candle      = false
bool        new_ph_2nd      = false
bool        new_pl_2nd      = false

if barstate.isconfirmed

    if pvh
        array.pop(pvh1_price)
        array.pop(pvh1_time)
        array.unshift(pvh1_price, pv1_high)
        array.unshift(pvh1_time, pv1_time)
        if array.size(pvh1_price) > 2
            temp_pv_0 := array.get(pvh1_price, 0)
            temp_pv_1 := array.get(pvh1_price, 1)
            temp_pv_2 := array.get(pvh1_price, 2)
            if temp_pv_0 > temp_pv_1
                for i = 0 to array.size(pvl1_time) - 1 by 1
                    temp_ltcmrhh_time = array.get(pvl1_time, i)
                    if temp_ltcmrhh_time < array.get(pvh1_time, 0)
                        ltcmrhh_price := array.get(pvl1_price, i)
                        ltcmrhh_time := temp_ltcmrhh_time
                        break
            if temp_pv_0 < temp_pv_1 and temp_pv_1 > temp_pv_2
                array.pop(pvh2_price)
                array.pop(pvh2_time)
                array.unshift(pvh2_price, temp_pv_1)
                array.unshift(pvh2_time, array.get(pvh1_time, 1))
                new_ph_2nd := true

    if pvl
        array.pop(pvl1_price)
        array.pop(pvl1_time)
        array.unshift(pvl1_price, pv1_low)
        array.unshift(pvl1_time, pv1_time)
        if array.size(pvl1_price) > 2
            temp_pv_0 := array.get(pvl1_price, 0)
            temp_pv_1 := array.get(pvl1_price, 1)
            temp_pv_2 := array.get(pvl1_price, 2)
            if temp_pv_0 < temp_pv_1
                for i = 0 to array.size(pvh1_time) - 1 by 1
                    temp_htcmrll_time = array.get(pvh1_time, i)
                    if temp_htcmrll_time < array.get(pvl1_time, 0)
                        htcmrll_price := array.get(pvh1_price, i)
                        htcmrll_time := temp_htcmrll_time
                        break
            if temp_pv_0 > temp_pv_1 and temp_pv_1 < temp_pv_2
                array.pop(pvl2_price)
                array.pop(pvl2_time)
                array.unshift(pvl2_price, temp_pv_1)
                array.unshift(pvl2_time, array.get(pvl1_time, 1))
                new_pl_2nd := true

    if trigger_high > htcmrll_price
        if msb_sv
            array.push(bull_bos_lines, line.new(x1=htcmrll_time, y1=htcmrll_price, x2=bar_index, y2=htcmrll_price, color=color.red, width=2))
        if box_sv
            array.push(long_boxes, box.new(left=array.get(pvl1_time, 0), top=math.min(high[bar_index - array.get(pvl1_time, 0)], high[bar_index - array.get(pvl1_time, 0) + 1]), right=bar_index, bottom=array.get(pvl1_price, 0), bgcolor=color.rgb(0, 255, 0, 80), border_color=color.rgb(0, 255, 0, 80), extend=extend.right))
        bos_candle := true
        htcmrll_price := na
        htcmrll_price

    if trigger_low < ltcmrhh_price
        if msb_sv
            array.push(bear_bos_lines, line.new(x1=ltcmrhh_time, y1=ltcmrhh_price, x2=bar_index, y2=ltcmrhh_price, color=color.green, width=2))
        if box_sv
            array.push(short_boxes, box.new(left=array.get(pvh1_time, 0), top=array.get(pvh1_price, 0), right=bar_index, bottom=math.max(low[bar_index - array.get(pvh1_time, 0)], low[bar_index - array.get(pvh1_time, 0) + 1]), bgcolor=color.rgb(255, 0, 0, 80), border_color=color.rgb(255, 0, 0, 80), extend=extend.right))
        bos_candle := true
        ltcmrhh_price := na
        ltcmrhh_price

    if array.size(short_boxes) > 0
        for i = array.size(short_boxes) - 1 to 0 by 1
            tbox = array.get(short_boxes, i)
            top = box.get_top(tbox)
            bottom = box.get_bottom(tbox)
            if trigger_high > bottom and box.get_left(tbox) + box_test_delay < bar_index and box_test_sv
                box.set_bgcolor(tbox, color.rgb(192, 192, 192, 80))
                box.set_border_color(tbox, color.rgb(192, 192, 192, 80))
            if trigger_high > top and box.get_left(tbox) + box_fill_delay < bar_index
                if box_stop_sv
                    box.set_right(tbox, bar_index)
                    box.set_extend(tbox, extend.none)
                    array.unshift(oldshort_boxes, tbox)
                    array.remove(short_boxes, i)

    if array.size(long_boxes) > 0
        for i = array.size(long_boxes) - 1 to 0 by 1
            lbox = array.get(long_boxes, i)
            top = box.get_top(lbox)
            bottom = box.get_bottom(lbox)
            if trigger_low < top and box.get_left(lbox) + box_test_delay < bar_index and box_test_sv
                box.set_bgcolor(lbox, color.rgb(192, 192, 192, 80))
                box.set_border_color(lbox, color.rgb(192, 192, 192, 80))
            if trigger_low < bottom and box.get_left(lbox) + box_fill_delay < bar_index
                if box_stop_sv
                    box.set_right(lbox, bar_index)
                    box.set_extend(lbox, extend.none)
                    array.unshift(oldlong_boxes, lbox)
                    array.remove(long_boxes, i)
    if pv2_sv
        if new_ph_2nd
            array.pop(la_ph2)
            array.unshift(la_ph2, label.new(x = array.get(pvh2_time, 0), y = array.get(pvh2_price, 0), xloc = xloc.bar_index, style = label.style_label_down,    color = #770000FF, size = size.tiny))
        if new_pl_2nd
            array.pop(la_pl2)
            array.unshift(la_pl2, label.new(x = array.get(pvl2_time, 0), y = array.get(pvl2_price, 0), xloc = xloc.bar_index, style = label.style_label_up,      color = #007700FF, size = size.tiny))

barcolor(bos_candle and bos_sv ? color.yellow : na)
Support/Resistance V2
// This source code is subject to the terms of the Mozilla Public License 2.0 at https://mozilla.org/MPL/2.0/
//@version=4
study("Support/Resistance", shorttitle="S/R", overlay=true, scale = scale.right, linktoseries = true)

line_width = input(4, type = input.integer, title="SR Level line Width")
level_min_lengh = input(4, type = input.integer, title="Set minimum number of bars from level start to qualify a level")
y  = input("Orange", "Line Color", options=["Red", "Lime", "Orange", "Teal", "Yellow", "White", "Black"])
line_extend = input(false, type = input.bool, title = "Extend Level line Right") ? extend.right : extend.none
sr_tf = input("", type = input.resolution, title="SR Timeframe (Beta)")

//color function
colour(z) => z=="Red"?color.red:z=="Lime"?color.lime:z=="Orange"?color.orange:z=="Teal"?
 color.teal:z=="Yellow"?color.yellow:z=="Black"?color.black:color.white

//Legacy RSI calc
rsi_src = close, len = 9
up1 = rma(max(change(rsi_src), 0), len)
down1 = rma(-min(change(rsi_src), 0), len)
legacy_rsi = down1 == 0 ? 100 : up1 == 0 ? 0 : 100 - (100 / (1 + up1 / down1))

//CMO based on HMA
length = 1
src1 = hma(open, 5)[1] // legacy hma(5) calculation gives a resul with one candel shift, thus use hma()[1]
src2 = hma(close, 12)
momm1 = change(src1)
momm2 = change(src2)
f1(m, n) => m >= n ? m : 0.0
f2(m, n) => m >= n ? 0.0 : -m
m1 = f1(momm1, momm2)
m2 = f2(momm1, momm2)
sm1 = sum(m1, length)
sm2 = sum(m2, length)
percent(nom, div) => 100 * nom / div
cmo_new = percent(sm1-sm2, sm1+sm2)

//Legacy Close Pivots calcs.
len5 = 2
h = highest(len5)
h1 = dev(h, len5) ? na : h
hpivot = fixnan(h1)
l = lowest(len5)
l1 = dev(l, len5) ? na : l
lpivot = fixnan(l1)

//Calc Values

rsi_new = rsi(close,9)
lpivot_new =  lpivot  // use legacy pivots calculation as integrated pivotlow/pivothigh functions give very different result
hpivot_new =  hpivot

sup = rsi_new < 25 and cmo_new > 50  and lpivot_new
res = rsi_new > 75 and cmo_new < -50  and hpivot_new
calcXup() =>
    var xup = 0.0
    xup :=  sup ? low : xup[1]
calcXdown() =>
    var xdown = 0.0
    xdown := res ? high : xdown[1]

//Lines drawing variables
tf1 = security(syminfo.tickerid, sr_tf, calcXup(), lookahead=barmerge.lookahead_on)
tf2  = security(syminfo.tickerid, sr_tf, calcXdown(), lookahead=barmerge.lookahead_on)

//SR Line plotting
var tf1_line = line.new(0, 0, 0, 0)
var tf1_bi_start = 0
var tf1_bi_end = 0
tf1_bi_start := change(tf1) ? bar_index : tf1_bi_start[1]
tf1_bi_end := change(tf1) ? tf1_bi_start : bar_index
if change(tf1)
    if (line.get_x2(tf1_line) - line.get_x1(tf1_line)) < level_min_lengh
        line.delete(tf1_line)
    tf1_line := line.new(tf1_bi_start, tf1, tf1_bi_end, tf1, color = colour(y), width = line_width, extend = line_extend)
line.set_x2(tf1_line, tf1_bi_end)

var tf2_line = line.new(0, 0, 0, 0)
var tf2_bi_start = 0
var tf2_bi_end = 0
tf2_bi_start := change(tf2) ? bar_index : tf2_bi_start[1]
tf2_bi_end := change(tf2) ? tf2_bi_start : bar_index
if change(tf2)
    if (line.get_x2(tf2_line) - line.get_x1(tf2_line)) < level_min_lengh
        line.delete(tf2_line)
    tf2_line := line.new(tf2_bi_start, tf2, tf2_bi_end, tf2, color =  colour(y), width = line_width, extend = line_extend)
line.set_x2(tf2_line, tf2_bi_end)

alertcondition(change(tf1) != 0 or change(tf2) != 0 , message = "New S/R line" )
</details>

I might suggest one change to both:  let the user select the candle interval for the indicators to base their visuals on, rather than fixing them to the graph's current interval.  That way you can see order blocks based on 1 hour candles, while the graph shows the 5 minute interval.

If it matters, I use this project by way of the v3.aggr.trade website.
This should be possible using current scripting language (expect for the security() part ofc, which I don't plan to add)
This is all about using the brokenarea() plot type which can draw fixed or extended rectangles and lines. It's the most advanced drawing type on aggr. I may do a complete wiki on this one if I have time
if you can add the indicators, can you send it to me as a draft? I sent you an e-mail, get back to me
Hey Tucsky, for OB to make sense, it requires data from a higher timeframe. e.g on the 1h chart and below, I'd want to see 4h, D, W, M OBs.
Per my current understanding, requesting higher timeframe data is not available - but am happy to learn if I am wrong.
Re.: brokenarea() never even saw it in the docs but gotta sneak into the code asap.