Add smart tags aggregation plot
Resolve #167
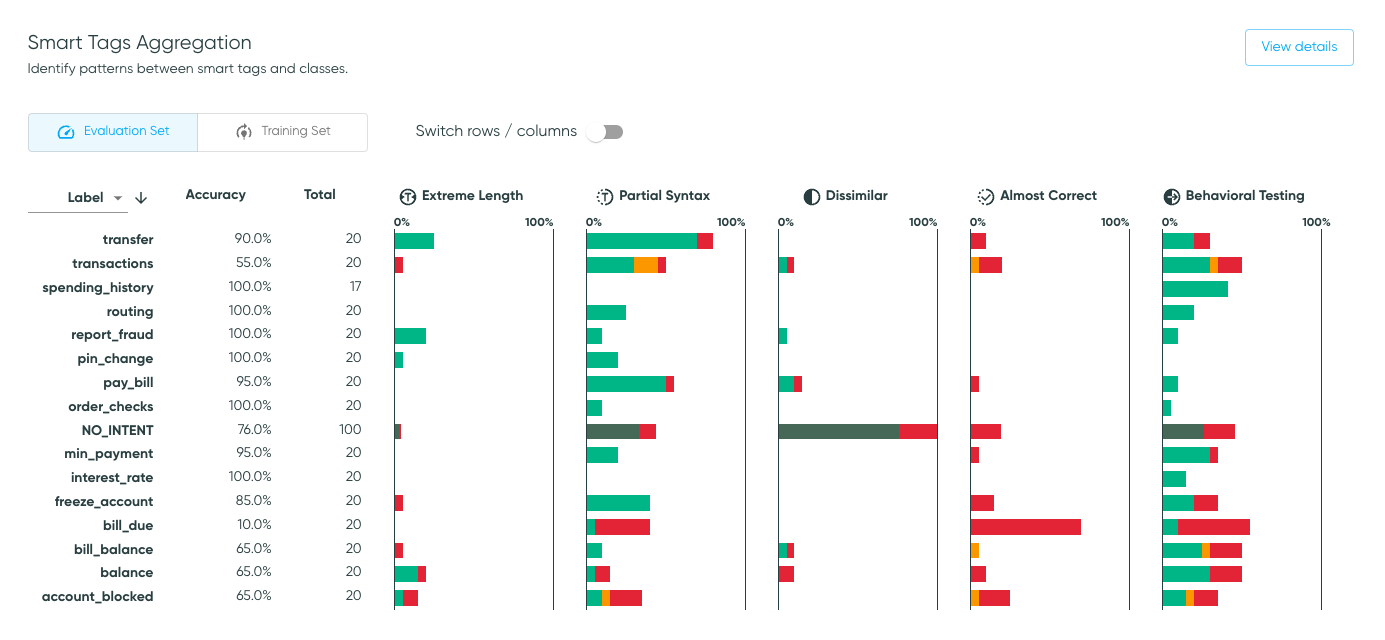
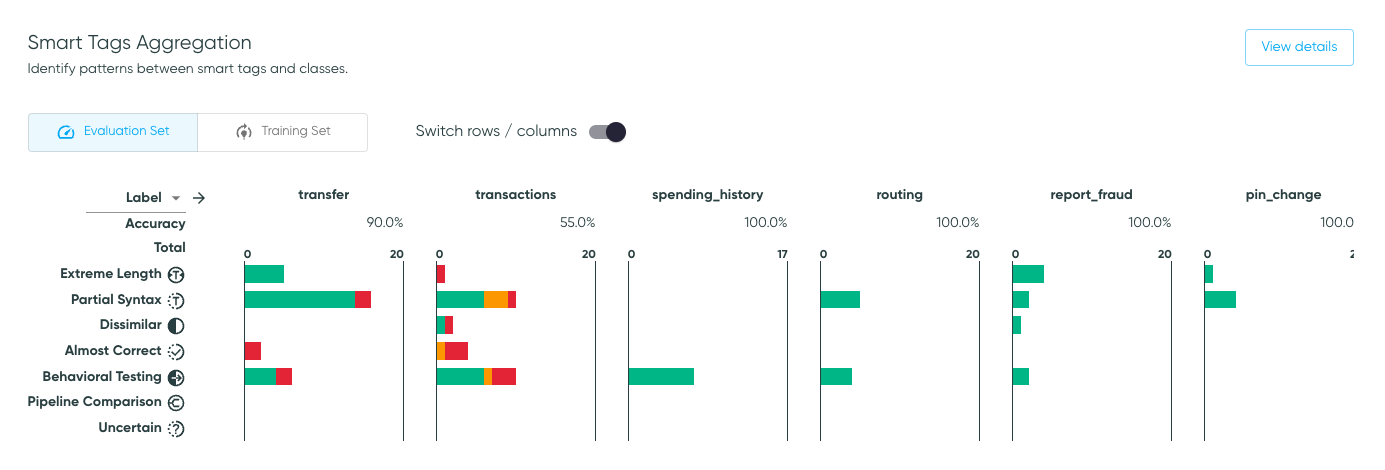
Description:
Add a smart tags aggregation page, as well as a card on dashboard.
A screenshot is worth a thousand words:
Checklist:
You should check all boxes before the PR is ready. If a box does not apply, check it to acknowledge it.
- [x] ISSUE NUMBER. You linked the issue number (Ex: Resolve #XXX).
- [x] PRE-COMMIT. You ran pre-commit on all commits, or else, you
ran
pre-commit run --all-filesat the end. - [ ] USER CHANGES. The changes are added to CHANGELOG.md and the documentation, if they impact our users.
- [x] DEV CHANGES.
- Update the documentation if this PR changes how to develop/launch on the app.
- Update the
READMEfiles and our wiki for any big design decisions, if relevant. - Add unit tests, docstrings, typing and comments for complex sections.
This looks awesome! I'm so excited! :D
One bug I found (I'm going to try to review in the code, but I'm not sure where this one is): When you click on a bar in the plot, if you are looking at Predictions instead of Labels, the link still goes to the exploration space with the Label filtered by the class in question.
I noticed that when you switch between the training and eval sets, the order of the classes changes. I think this is because it's going to a default that has to do with the sorting logic? I think it would be more expected behaviour to maintain the order of classes when you change dataset splits, e.g. to be able to compare the same class in both splits, then to maintain the order of the last column you sorted on. What do you think?