[quantizer] Visualize layer-wise qerror
What
Let's visualize quantization error in the quantized model
Why
To observe which quantized layer harms accuracy.
How
Input: fp32 circle, q circle, test data
Steps
- Fake quantize q circle
- Dump intermediate FMs of fp32 model with test data
- Dump intermediate FMs of fq model with test data
- Compare intermediate FMs and compute qerror
- Generate DOT graph

Nodes with higher qerror will be more red.
Sample (MobileNet V2 full uint8)

full graph (visible on web)
I think it's a good idea!
Let me ask some questions:)
-
After observing the harms, where can we use them?
-
Is there any chance to have a difference between the qerror with fake quant and the one with normal quant?
-
Above graph seems that qerror is not accumulated to the bottom layers. So, even if the qerror of upper layers are reduced, isn't there any possibility that the result of below layers will be worse?
Thanks for good questions!
where can we use them?
I can think of two possible use cases.
- Model design: Model developers can concentrate on sensitive layers of a model. Those layers may be replaced with other types of layers, or quantized with different parameters.
- Mixed-precision quantization: We can quantize sensitive layers with higher bits e.g., int16 rather than uint8.
Diff between qerror with fake quant and normal quant
Of course there exist differences. Using quant kernels (instead of fake quant) can be another option, but it is difficult to implement a wide coverage of quant kernels.
Fake quant is used in other ML frameworks (TF, PyTorch), and our experiments show that fake-quant kernels can mimic quant kernels quite accurately.
Qerror accumulation
We compare the same points in fp32 model and quant model, so qerrors are in fact accumulated. We can observe in which points qerrors are increased.
I think that in general, the reduction of qerror in any layer will reduce the qerror of the final result. There can be counter-examples, but they may be very rare cases.
I'm finding a good name for this module
Candidates: visqerror (visualize qerror), or visq
Interface will be like below.
$ visqerror --fp32_circle sample.circle \
  --q_circle sample.q.circle \
  --data test.h5 \
  --peir_output peir_output.dot \
  --mse_output mse_output.dot
The above command will compute peir and mse between sample.circle and sample.q.circle, and generate qerror dot graphs peir_output.dot and mse_output.dot.
Any suggestion for naming or interface is welcome!
CC @lemmaa @seanshpark @mhs4670go
visq looks nice for module name in compiler.
for the tool name, visqerror or visqerr looks OK.
interface looks OK :)
I like both names. But, the visqerror feels uniquely like something snakes wriggling. :)
Anyway, when I first saw the picture of https://github.com/Samsung/ONE/issues/9694#issue-1365521751, I felt something like this. It would be interesting to have a name that conveys this feeling. :)
Had a short offline talk with @jinevening ,
- best UI would be to generate(?) a html file and drop to a browser and see the graph
- looking inside, we can generate some model file (in JSON?) and use (1) browser as viewer (2) some eletron app as a viewer (3) netron-visq, modified netron like netron-circle
- we can also think of ONE-vscode too
- using HTML-JS-CSS would take time so we can go with in parallel to DOT file viewing.
With this scenario,
- user creates
.jsonfile withvisqcommand line -
visqwill create(or mayby just copy from somewhere)htmland the data.jsonfile - with something like
--view-in-browseroption,visqwill invoke the browser withhtmlfile - browser will show the quantization error graph
I'v done some test with loading a local file from local .html in the browser.
- we can use
FileReaderclass ONLY with<input>tag, that is, user MUST select the file in HTML view. --> this seems odd with above scenario - we can NOT use
XMLHttpRequestas browser rejects by security reasons - we can put as json object in
.jsfile and use it from the rendering logicconst data = { ... };
We can use nodejs as local file server but seems getting too far...
Found an issue when we use .circle file for the model and .json for the error data.
- reading a local file in the javascript is impossible cause of security reasons (mentioned above)
- cannot read
.circle
To resolve this...
- convert
.circlefile also to.jsin form of.json? --> done this in ONE-vscode and it's not good - use nodejs as local web server
- use electron app
- define simple
.jsonform of both model.circleand error.json - ...
I'm doing some experiment using nodejs and seems working. But not sure with this usage scenario;
- user runs visq tool to create error json file
- user runs visquv tool (to see error json file, with the default web browser, through nodejs.
I'm thinking of two scenarios.
- Using web server
We can make a web page running the visquv server (ex: by github page).
Users will generate qerror json file using visq, and upload the json file to the web page to visualize qerror.
pros: Qerrors can be saved in a single json file.
cons: Users should access to our web page to see the visq graph.
- Creating local html file
visquv can generate a full html file (locally executable) from the json file.
Users will open the html file on their local environment.
pros: Users can directly see qerror graph in local environment. cons: Qerror results will be saved in a complex form (ex: html/css/js ...).
My first thought was the second option, which allows users to open the qerror graph using their browser in local environment.
It seems that #9852 is more appropriate for the first scenario. And I think the first scenario is also good :)
Preliminary proposal of qerror json format
From a short offline discussion with @jinevening , json format will have
- meta section
- source circle model file
- array of color, begin, end with N items
- array of color scheme (in separate key-value?)
- title as display name of this qerr
- error data section for multiple subgraphs
- [ { "node" : "value" }, ... ]
for example
{
  "meta" : {
    "title" : "Test of VISQ"
    "model" : "test_error.circle",
    "metric": "MPEIR",
    "colorscheme" : [
      { "b": "0.0020", "e": "0.0929", "c": "#ffeda0" },
      { "b": "0.0929", "e": "0.1838", "c": "#feb24c" },
      { "b": "0.1838", "e": "0.2747", "c": "#fc4e2a" }
    ]
  },
  "error": [
    {
      "ofm_conv": "0.01",
      "ofm_mul": "0.1",
      "ofm_add": "0.2"
    }
  ]
}
updates
- error is array to hold multiple subgraphs
- added title as title of viewer
Thanks. The example looks good to me! Let me leave some comments.
-
How about removing "scheme" and renaming "range" to "colorscheme"? It seems that rgb values are duplicate.
-
I think "metric" can be added to "meta" section, which describes the metric of qerror. For example,
"metric": "PEIR"
experiment result of draft code
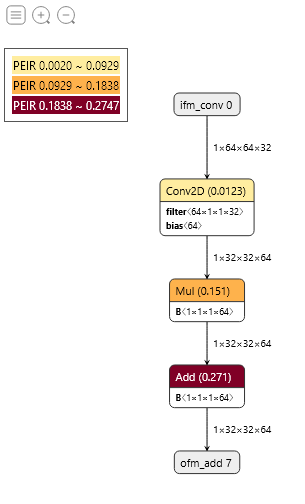
updates
- auto text color white/black from fill color luminance
- added legend table
- show PEIR value for each node
TODO with draft
- [x] text color to white with dark node
- [x] show legend table
- [x] show PEIR value in node
- [ ] let
nodehave qerror attributes - [ ] ...
@jinevening , current qerror json format cannot provide for multiple subgraphs. for now, we may support for only single subgraph, but the format should support this. I'll update the the format.
@Samsung/nncc , I'd like to get some opinions about the draft code in #9862,
- basic external code struture is from ONE-vscode media/CircleGraph; is this OK for ONE too?
- we had mostly c/c++ and python codes. js is new. what do you guys think of this?
- our debian package may need depedency to nodejs if we continue with current implementation.
- any other things about the implementation
Had a short offline talk with @lemmaa and,
- providing a viewer tool as visquv in ONE itself is OK
- I have a plan to provide this in ONE-vscode, which will be a duplicate
- duplicate is not nice to maintain
- conclusion; it would be better to move visquv to ONE-vscode
Other's thoughts are welcome :)
Since we decided to use multiple viewers (dot and web), I think we should use repos as below.
visq in ONE: Generate qerror (json) file. visqerror executable is included in one-compiler package
Example
$ visqerror --fp32_circle sample.circle \
  --q_circle sample.q.circle \
  --data test.h5 \
  --mpeir_output mpeir.visq.json \
  --mse_output mse.visq.json
visquv in ONE-vscode
visqdot in python-tools
This will make less duplicate codes and simplify dependency (visquv and visqdot will depend on visqerror in one-compiler).
@jinevening , about the visq json file extension, how about using *.visq.json ?
- we already use
something.feature.jsonfile name convention
about the visq json file extension, how about using *.visq.json ?
Using convention looks good to me :) Something like inception_v3.mpeir.visq.json or inception_v3.mse.visq.json.
Q) I assume mpeir file and mse have the same format.. correct?
Q) "metric": "PEIR" exist for mpeir file and "metric": "MSE for mse file?
Q) in the graph, legend table, we should show MSE aaa ~ bbb for MSE metric?
Answers to all of the questions are yes.
For mpeir, "metric": "MPEIR" would be right.
@jinevening , FYI, initial version of Visquv in ONE-vscode has landed. As I know there is no daily release of ONE-vscode so you may need to build from source.
I close this issue as visq with dot graph printer is now successfully landed.