Lolipop with Mutant Allele Frequency instead of count
It would be useful if we could plot values other than count on the lollipop plot; in particular, we often find ourselves wanting to plot Mutant Allele Frequency. Ideally, this would be accomplished by giving a column name for the values to plot. I've managed to program a variation that works for plotting Mutant Allele Frequency from our .maf files, but I'm not sure how to make it more generally applicable.
Hi,
Is it possible to share a plot to demonstrate? I am guessing you would like to have VAF on the y-axis instead of frequency?
Thanks for the amazing tool!
Same request here. Would be great if the function could take a dataframe of unique SNV records and a column of custom "height" data (e.g. VAF, number of samples) and make the plot.
A good reference could be:
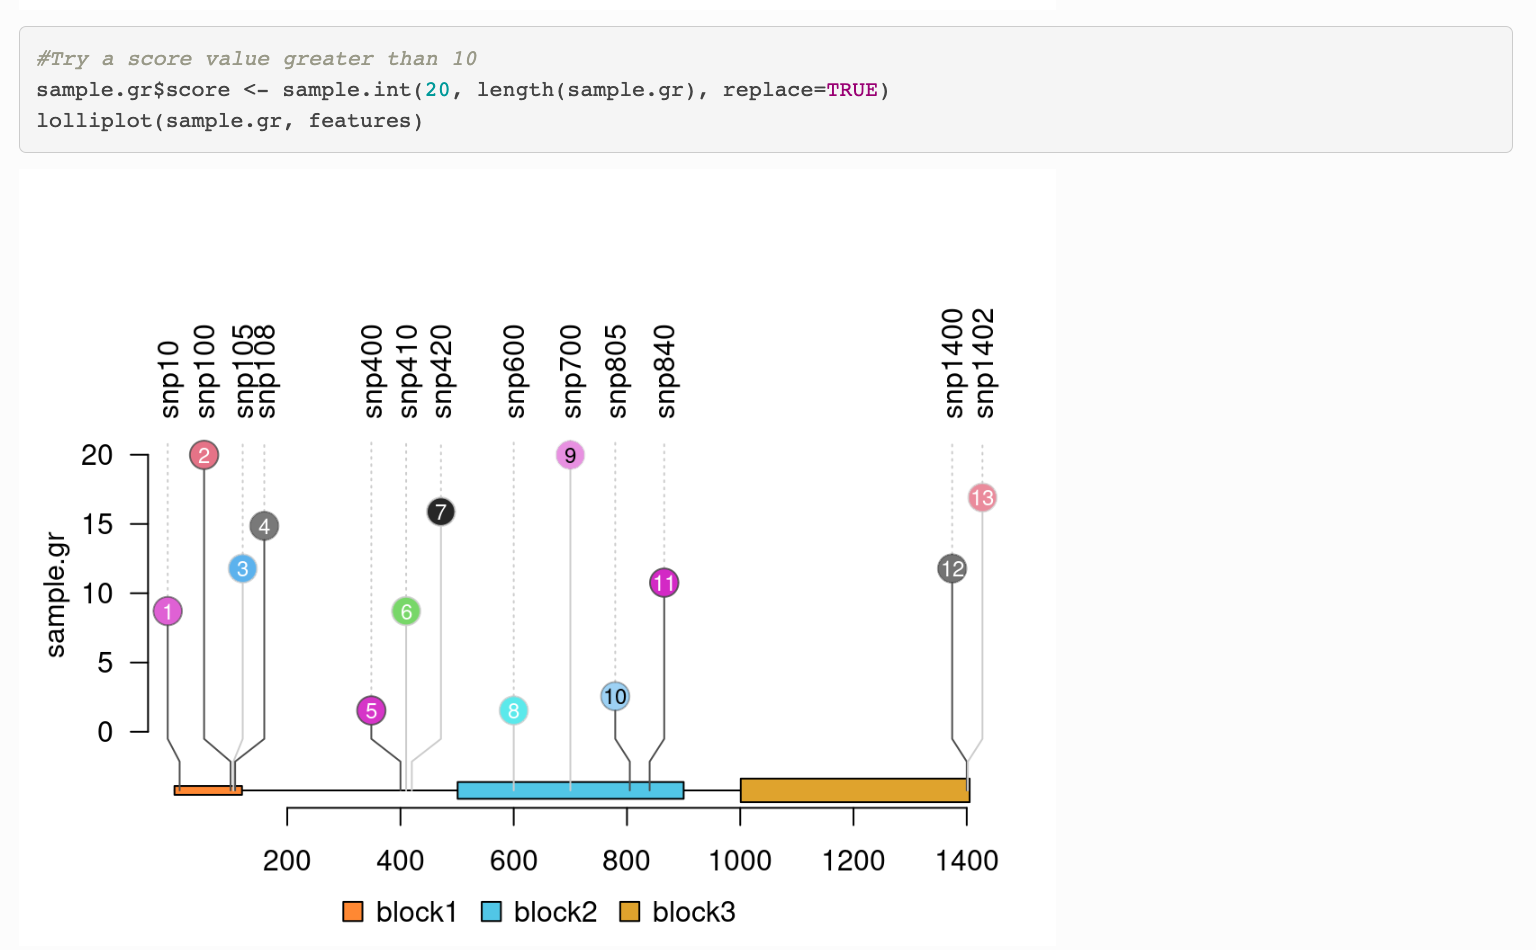 which was taken from this package (https://bioconductor.org/packages/release/bioc/vignettes/trackViewer/inst/doc/lollipopPlot.html#Change_the_height_of_a_lollipop_plot)
This issue is stale because it has been open for 60 days with no activity.
This issue was closed because it has been inactive for 14 days since being marked as stale.