`add_objects` has no effect
I am trying to make adjustText avoid a fitting curve drawn using plt.plot. I see that there is a add_objects argument seemingly for this very reason. I tried putting simply the return value of plt.plot, but it made a very strange plot, pushing everything to the top right. I plotted the boxes returned by get_bboxes when giving the argument of this return type, and the bbox is the entire axis.
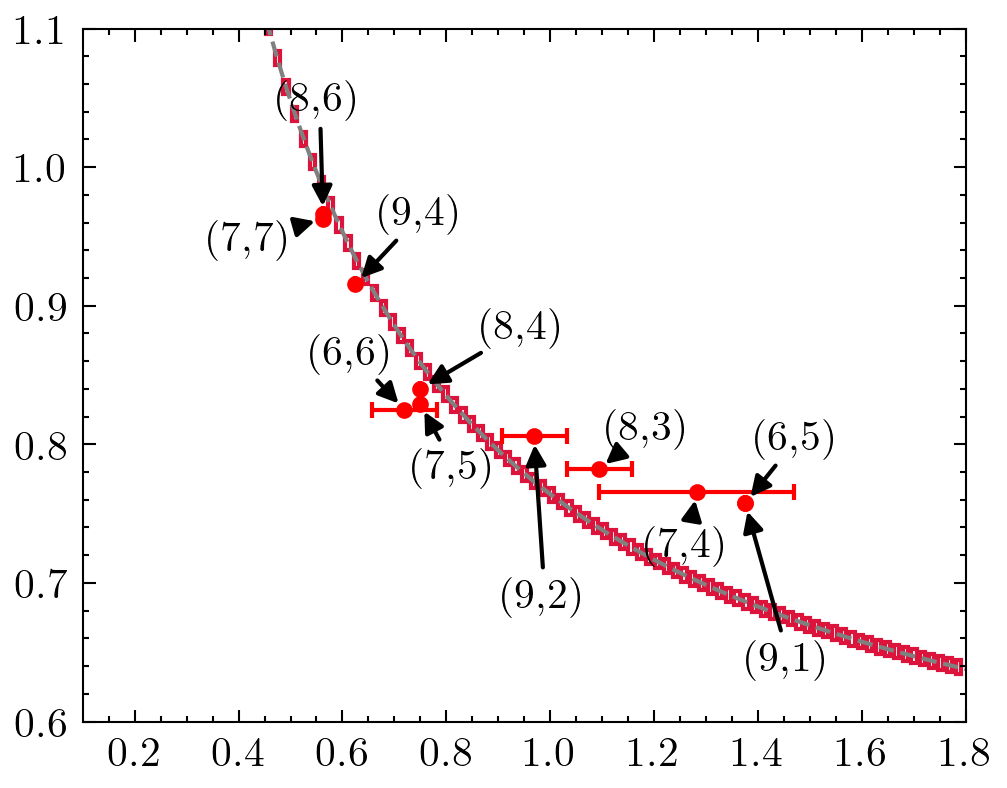
Therefore, I tried creating many small boxes along the curve, like so:
from matplotlib.transforms import Bbox
s = 0.01
boxes = [Bbox.from_bounds(x - s / 2, y - y / 2, s, s) for x, y in zip(fit_x, fit_y)]

adjust_text(..., add_objects=boxes)
for box in boxes:
    rec = plt.Rectangle((box.x0, box.y0), box.width, box.height, fill=False,
                        edgecolor="crimson")
    ax.add_patch(rec)
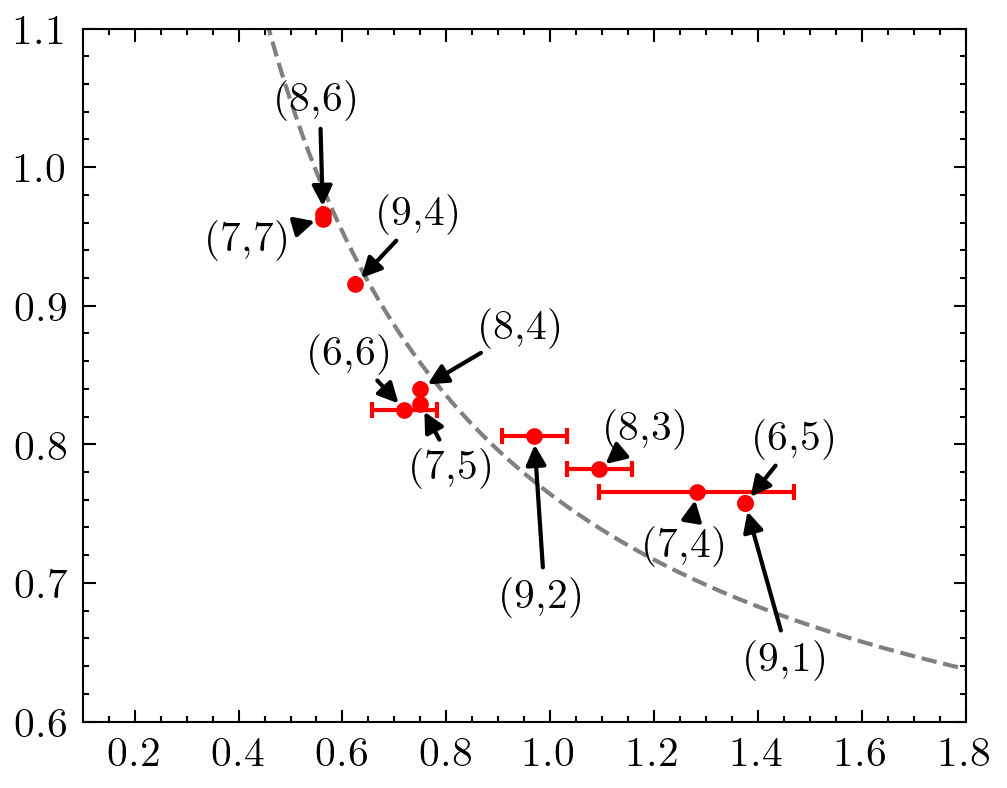
but it has no effect, as you can see in the before and after pictures below. You can see that (8,6) and (7,4) are overlapping with red boxes. I tried playing with expand_objects and force_objects, but it still seemed to do nothing. I also tried making the Bboxes bigger and smaller, but nothing.
Is this a bug? Am I missing something?
I am using the code from the master branch (upgraded after realizing that 0.7 did not support a list of bboxes).