Line Chart circles wrong color
Summary
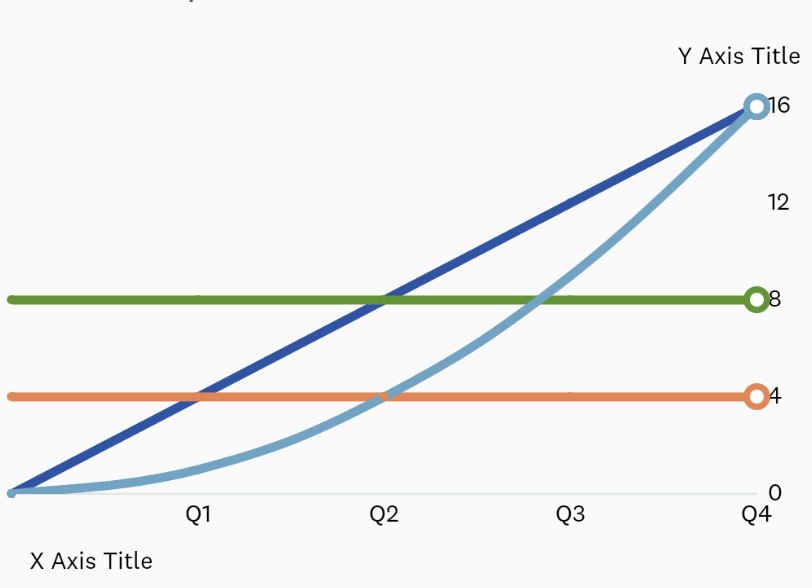
When CUBIC_BEZIER and LINEAR draw modes are used, in the same line chart, the color of the linear line data sets seem to take precedence over curved line datasets like in this screenshot:
The screenshot shows that the curved line that shares a point with a linear line has an orange dot instead of a blue dot.
Another case where I found the colors being rendered incorrectly is when line fill is applied, the dots seems to show through the line fill color as seen in the screenshot below:

Expected Behavior In the first screenshot, the expected behavior I see is the line should be consistently colored including the dots
In the second screenshot, the expected behavior is for the dots to be masked by the line fill.
Device (please complete the following information):
- Device: Google Pixel 3 (AVD)
- API Level: 33
- Library Version: v3.1.0
@kevin-ting-ck can you share some code sample if possible as I am unable to duplicate the issue mentioned in first screenshot.
@REXRITZ
Data set up:
val straightLineEntries = LineDataSet(createLineGraphEntries(0F, 1F, 5) {
    it * 4
}.toList(), "Straight Line").defaultValues(
    Color.parseColor("#2255A7"),
    false,
    4f
)

val curvedLineEntries = LineDataSet(createLineGraphEntries(0F, 1F, 5) {
    it * it
}, "Curved Line").defaultValues(
    Color.parseColor("#62A5C5"),
    true,
    4f
)

val constantEight = LineDataSet(createLineGraphEntries(0F, 1F, 5) {
    8F
}, "Constant 8").defaultValues(
    Color.parseColor("#529622"),
    false,
    4f
)

val constantFour = LineDataSet(createLineGraphEntries(0F, 1F, 5) {
    4F
}, "Constant 4").defaultValues(
    Color.parseColor("#EF814D"),
    false,
    4f
)
data = LineData()
data.addDataSet(straightLineEntries)
data.addDataSet(curvedLineEntries)
data.addDataSet(constantEight)
data.addDataSet(constantFour)

notifyDataSetChanged()
invalidate()
Utility methods:
fun createLineGraphEntries(
    xStart: Float,
    xStep: Float,
    numEntries: Int,
    yFunction: (Float) -> Float
) = mutableListOf<Entry>().apply {
    var x = xStart

    repeat(numEntries) {
        add(Entry(x, yFunction(x)))
        x += xStep
    }
}
fun LineDataSet.defaultValues(lineColorInt: Int, isCurvedLine: Boolean, dataLineWidth: Float) =
    also {
        setDrawValues(false)
        color = lineColorInt
        setDrawCircleHole(false)
        setDrawCircles(true)
        circleRadius = dataLineWidth / 2f
        setCircleColor(lineColorInt)
        axisDependency = YAxis.AxisDependency.RIGHT
        setDrawHorizontalHighlightIndicator(false)
        lineWidth = dataLineWidth

        mode = if (isCurvedLine) {
            LineDataSet.Mode.CUBIC_BEZIER
        } else {
            LineDataSet.Mode.LINEAR
        }
    }