Support
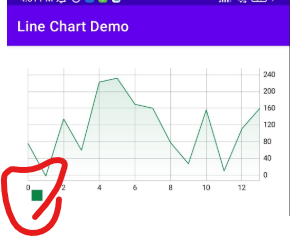 how can I abort that colored square and horizontal grids?
So, for your first issue, you are talking about the legend. However you are refering the graphic will display an option called Legend (variable) ( from getLegend() ), which then you can disable by:
Legend.isEnabled = False
NOTE: I'M USING AN OLDER VERSION OF MPANDROIDCHART (2.2.4) AS IT'S THE ONE THAT WAS USED IN THE TUTORIAL I WAS FOLLOWING, I HAVE NO IDEA ON HOW TO CREATE CHARTS BASED ON A NEWER VERSION NOR I DO KNOW IF THIS WILL WORK FOR YOU, BUT I THINK IT SHOULD.
Remember to take into account where you refer the chart, for example I've been trying to do it from the activity_main.xml via ViewBinding and findViewById, but nothing seems to work and I get a problem in the app telling me that "No chart data is alvailable".
I've been doing it this way:
binding.lineChart.data = data
binding.lineChart.legend.isEnabled = false
binding.lineChart.setBackgroundColor(resources.getColor(R.color.white))
binding.lineChart.animateXY(3000, 3000)
Soo... time to ask you. How did you get your LineChart working? Could you show me the code or anything? Even if it's a newer version.