Perturbations Table Module
What is it?
This adds a Perturbations Table Module, which shows how the predictions for datapoints created from generators compare to predictions for the original datapoints. This allows comparing predictions for the original datapoints side by side with the perturbations.
Why?
A minimal starting point for how LIT might support exploring how perturbations impact predictions.
Screenshots of UX
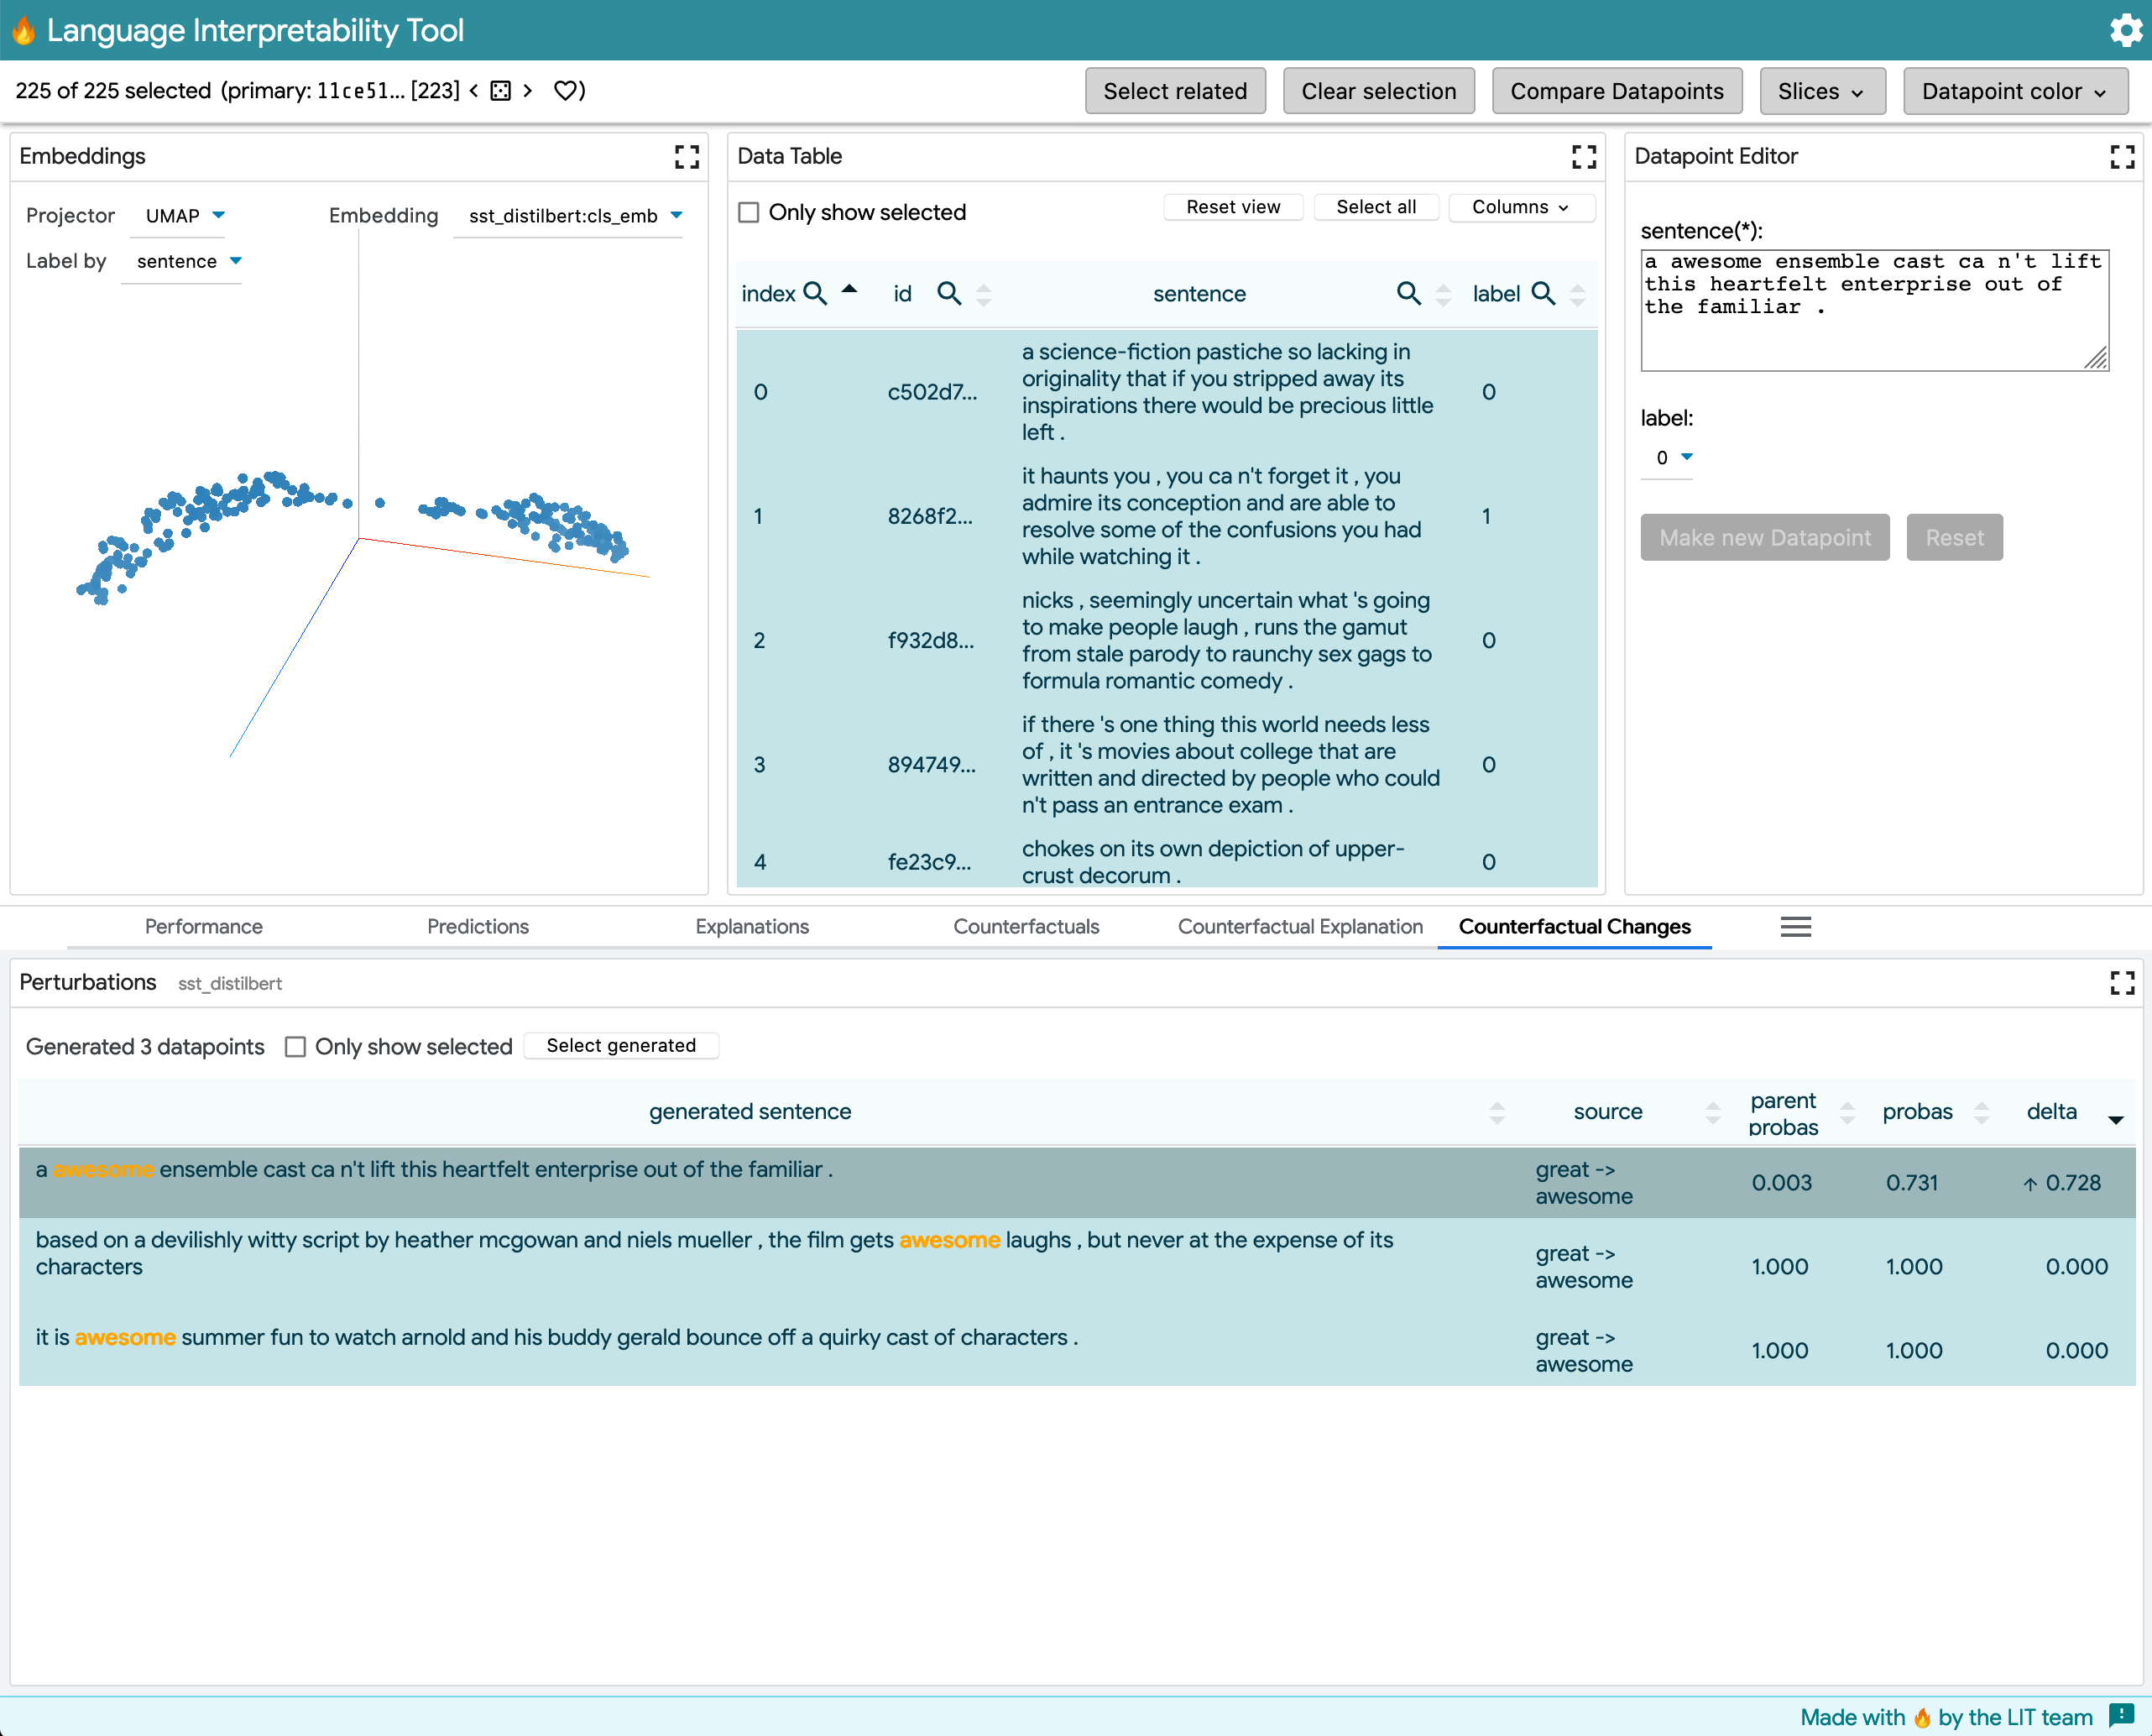
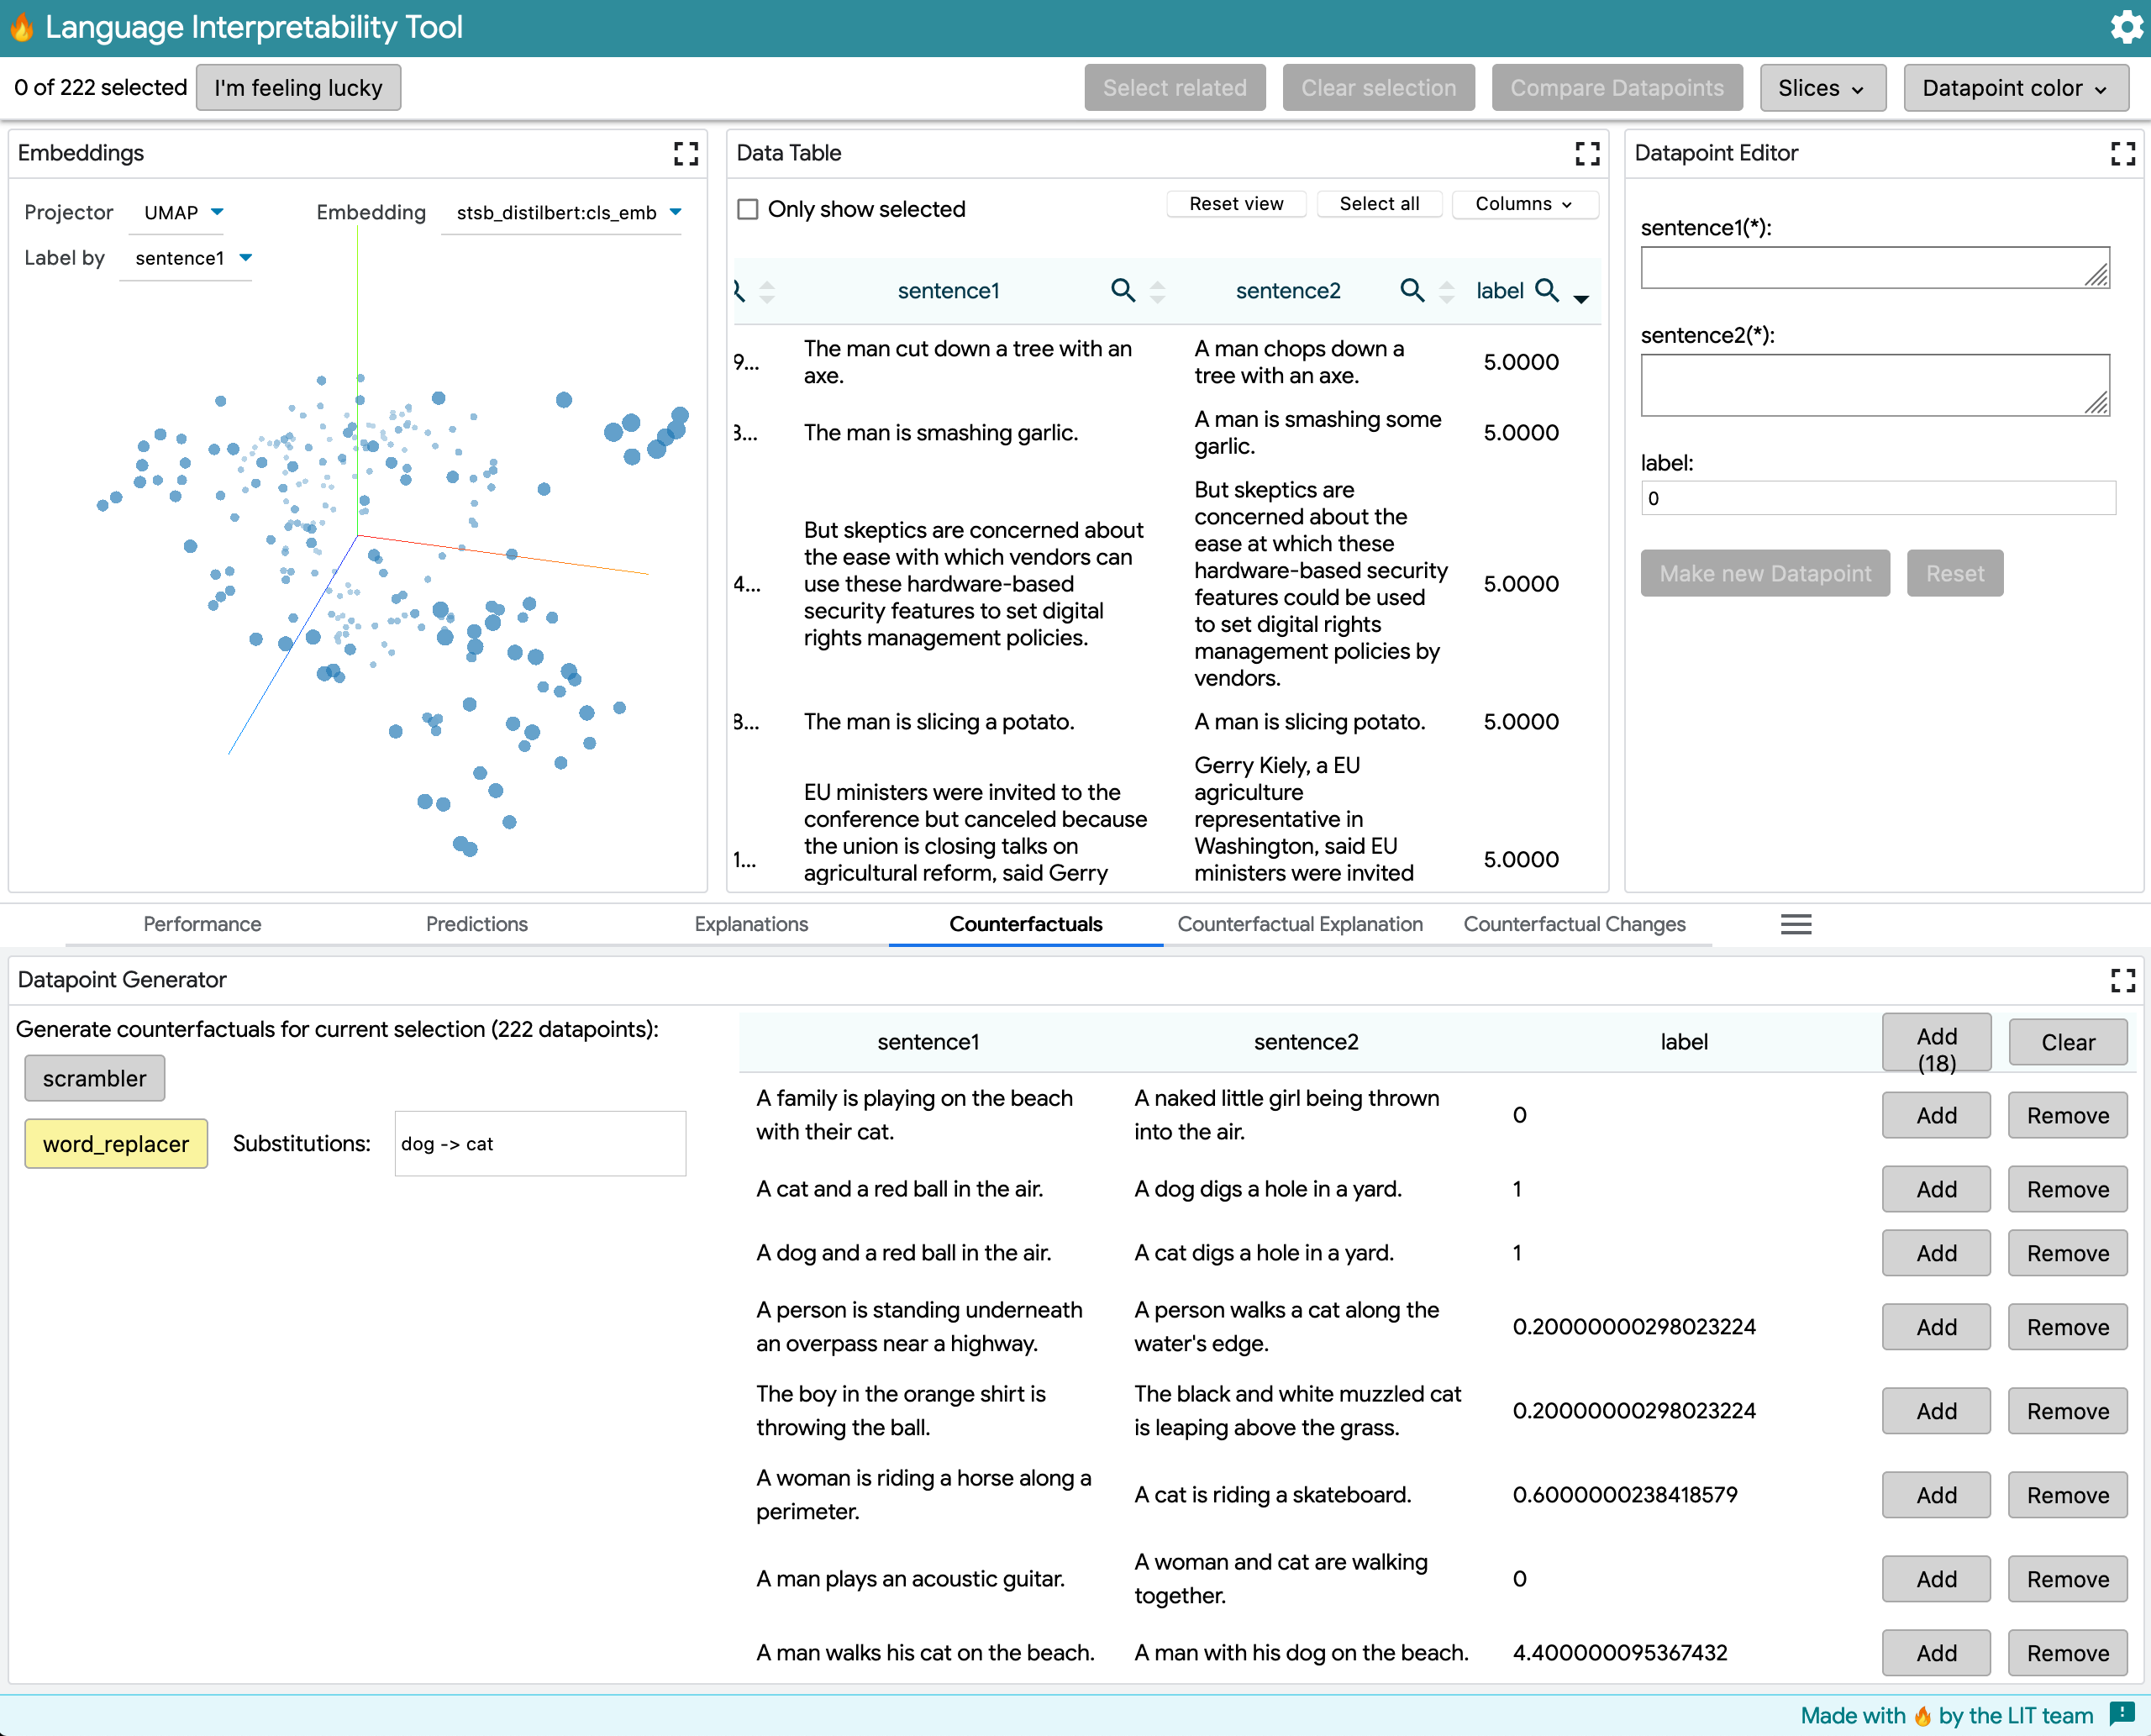
This module works for RegressionScore or MultiClassPreds. After generating counterfactuals, the module shows which generated data points had the greatest change in prediction. The core UX is the same, but for multiclass predictions there's a dropdown for selecting which output class to look at (in earlier iterations, these were paged through with arrows). By sorting by delta, we can see some points right away where the model's predictions changes quite a bit, in ways that perhaps reveal challenges with negation:
This pull request includes a perturbations_table_module_demo.py for manual testing across three model types: SST, MNLI and STSB.
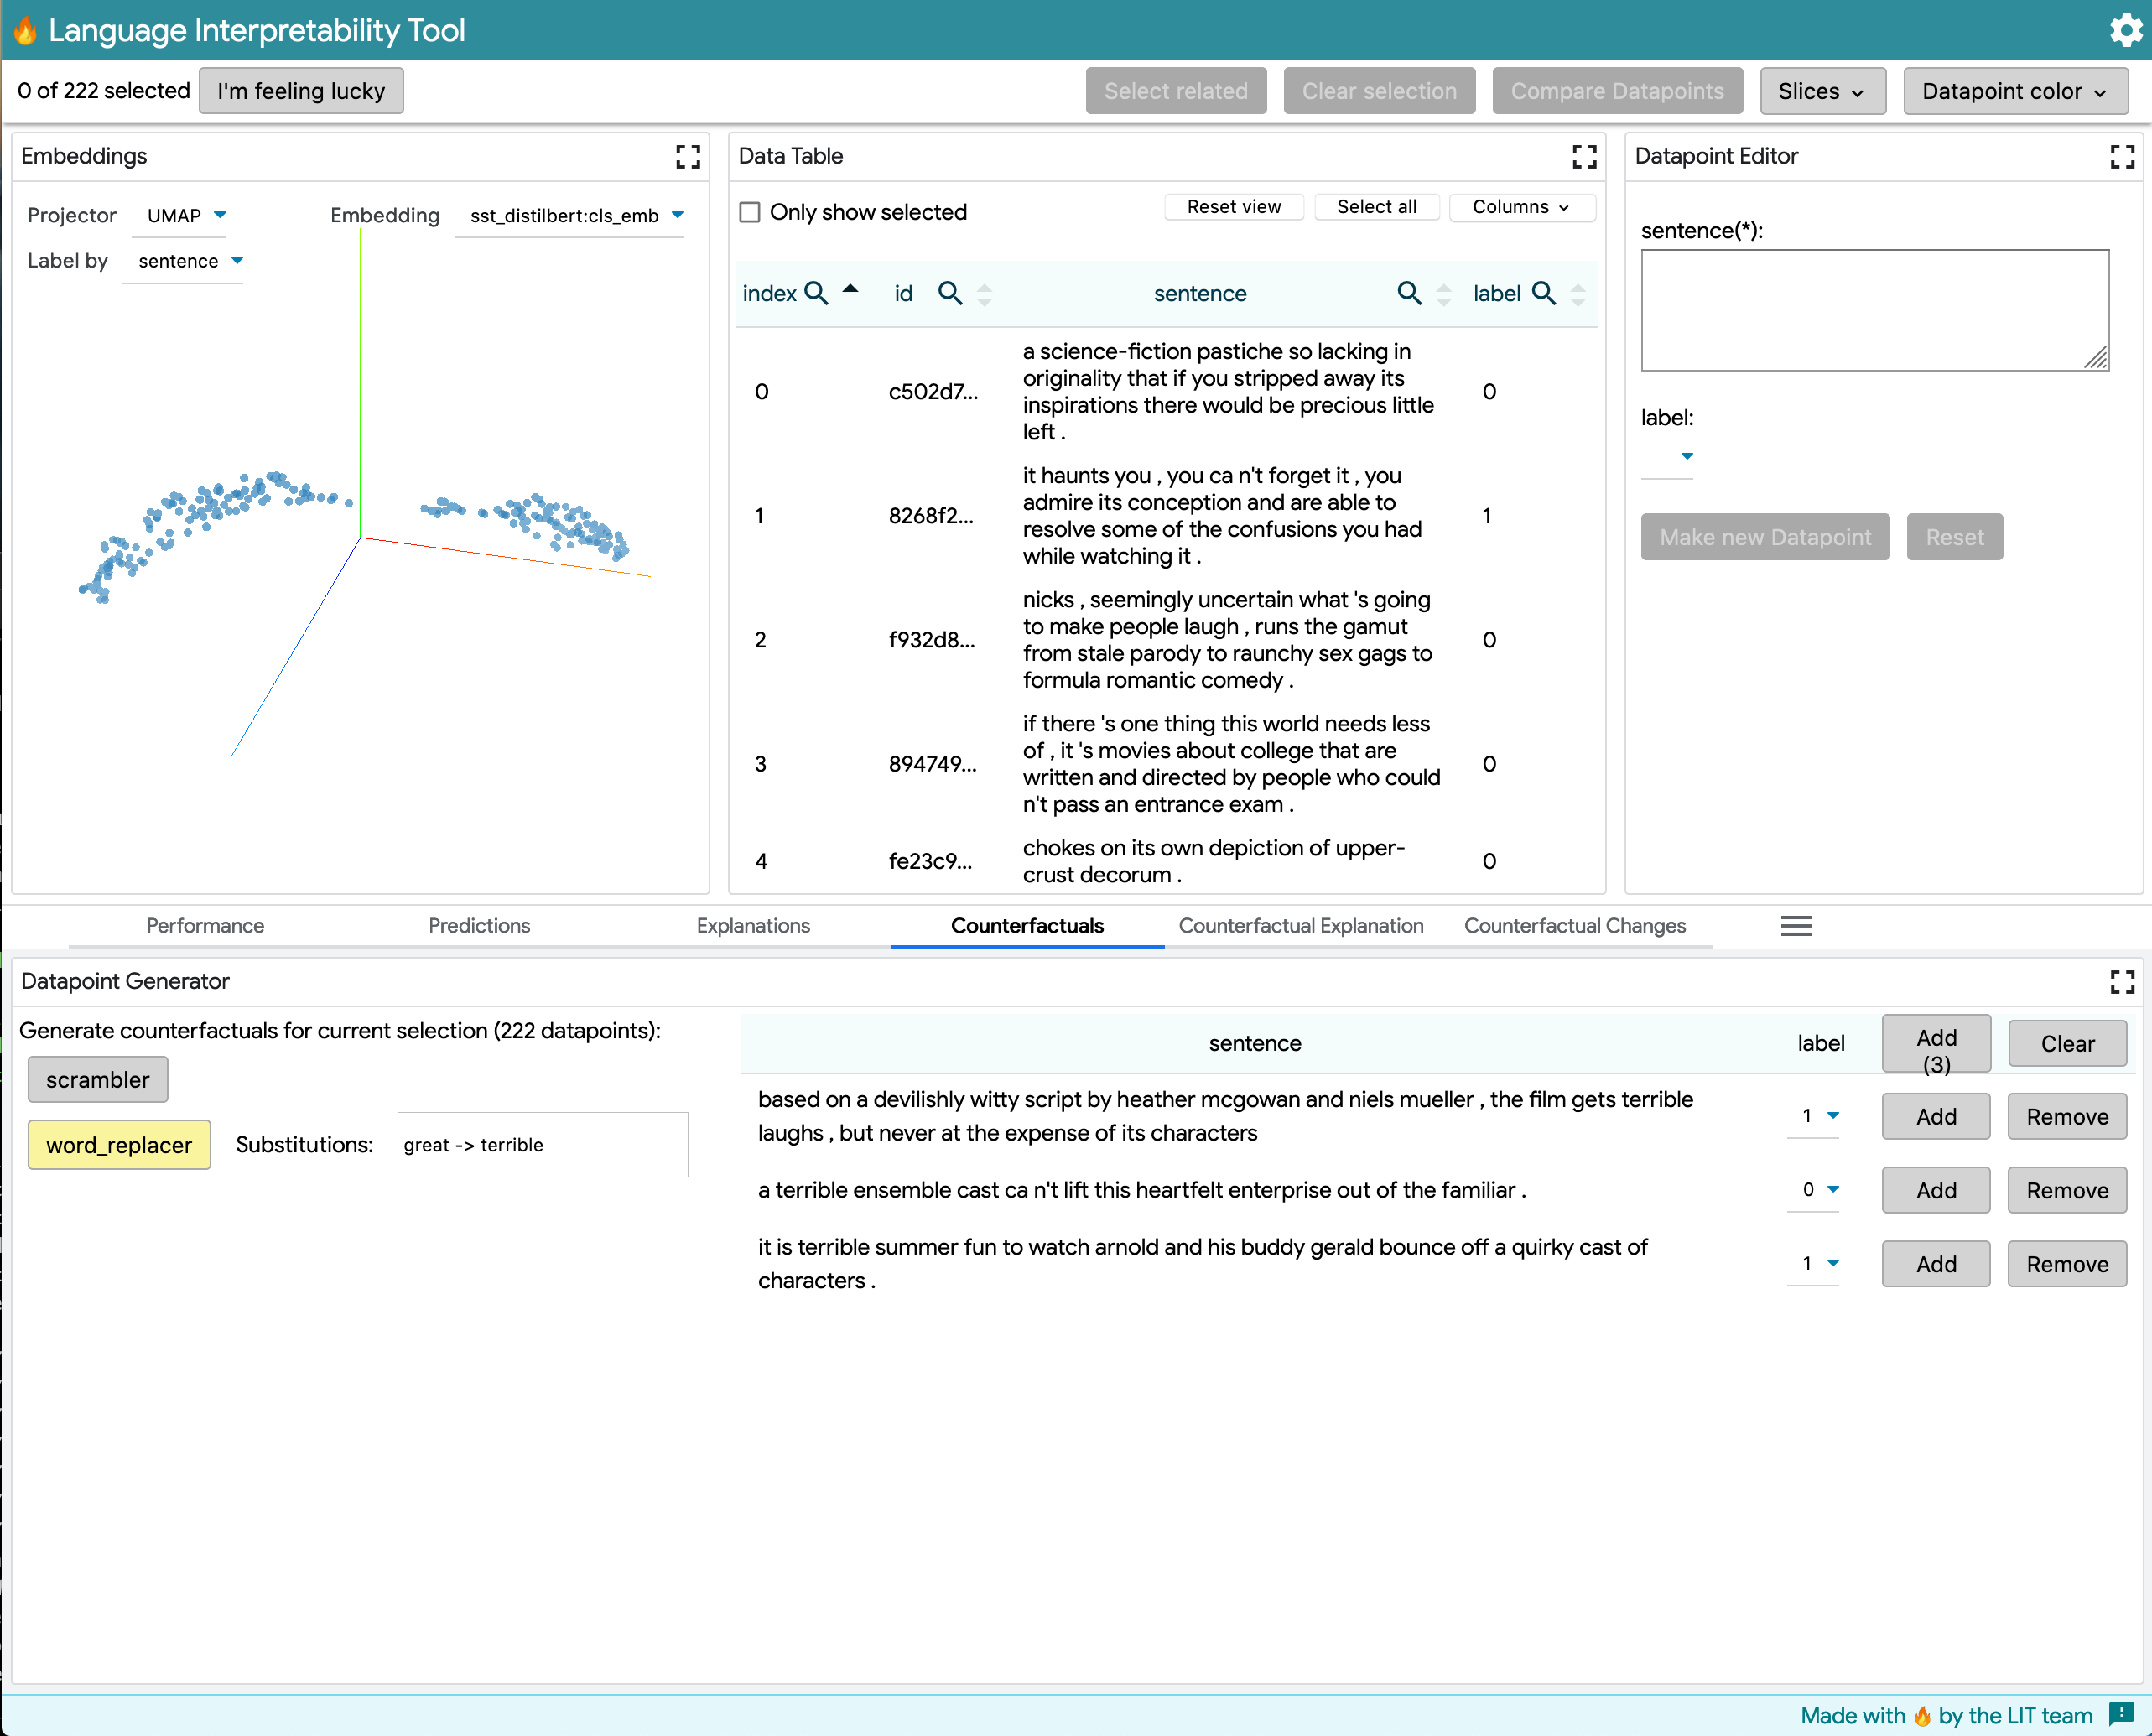
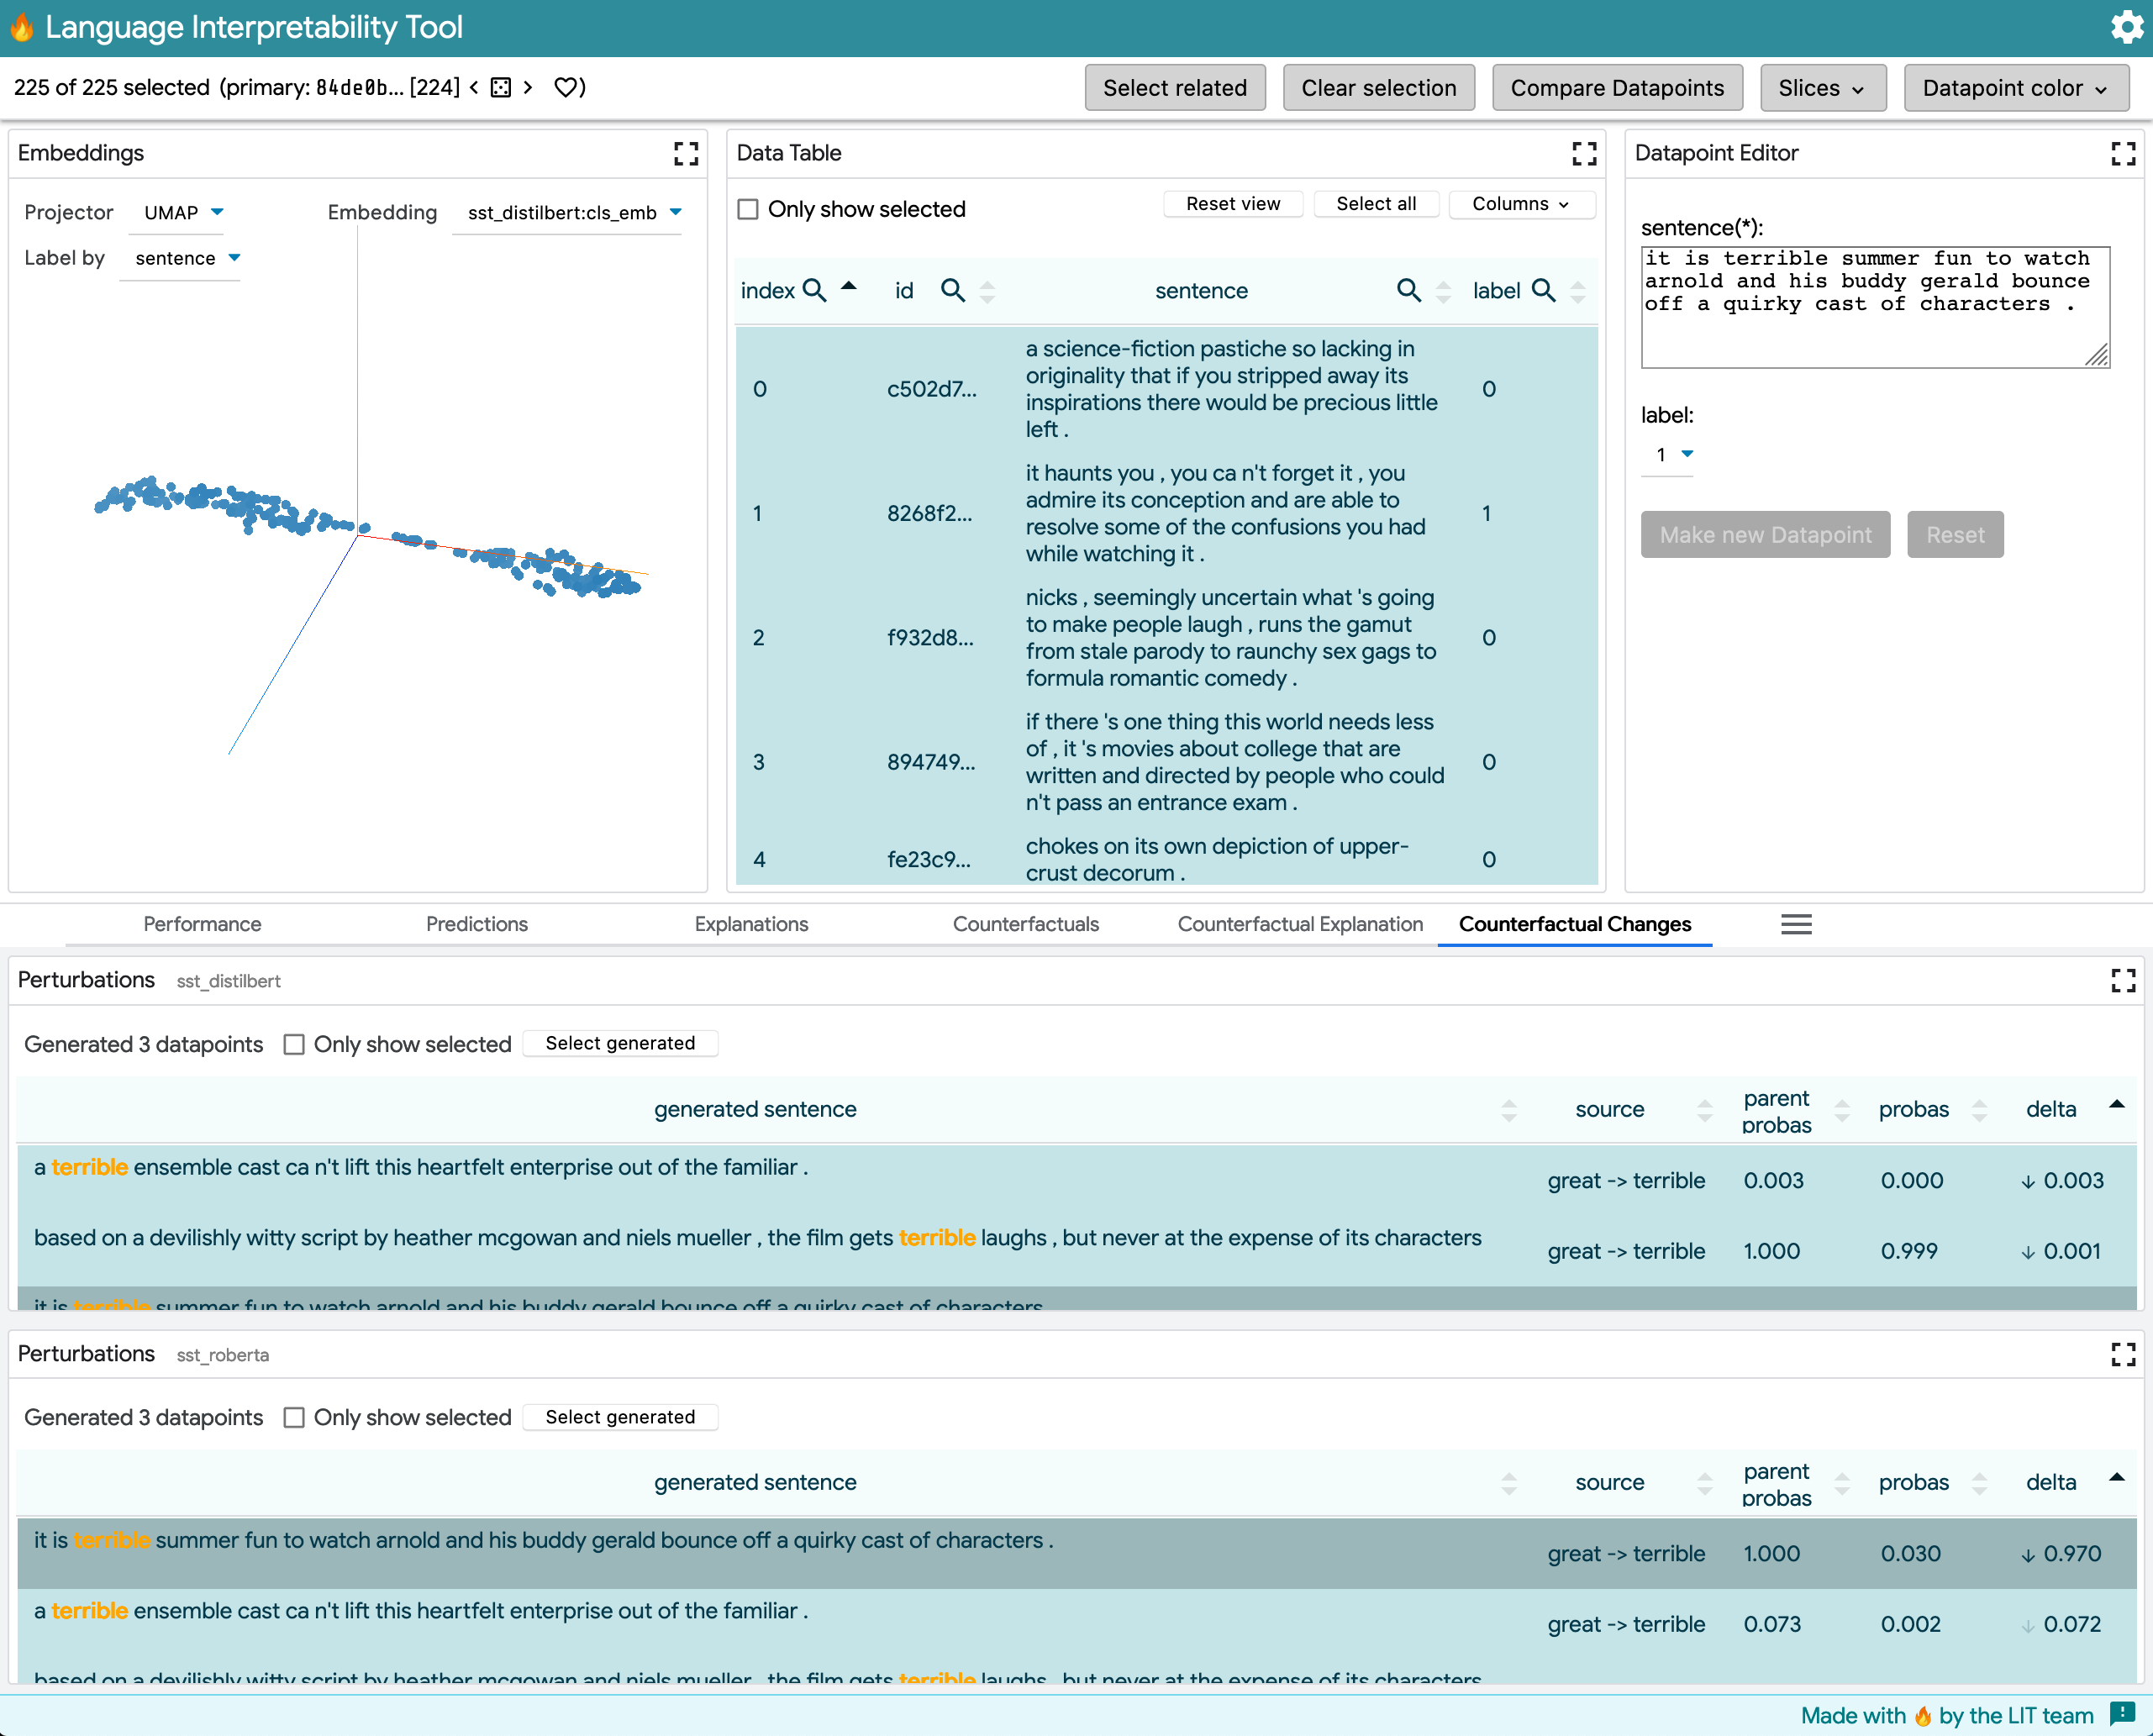
SST, binary classification:
This model outputs MultiClassPreds with only [0,1] prediction labels for positive sentiment in movie comments. The example shows word_replacer changing great -> terrible.

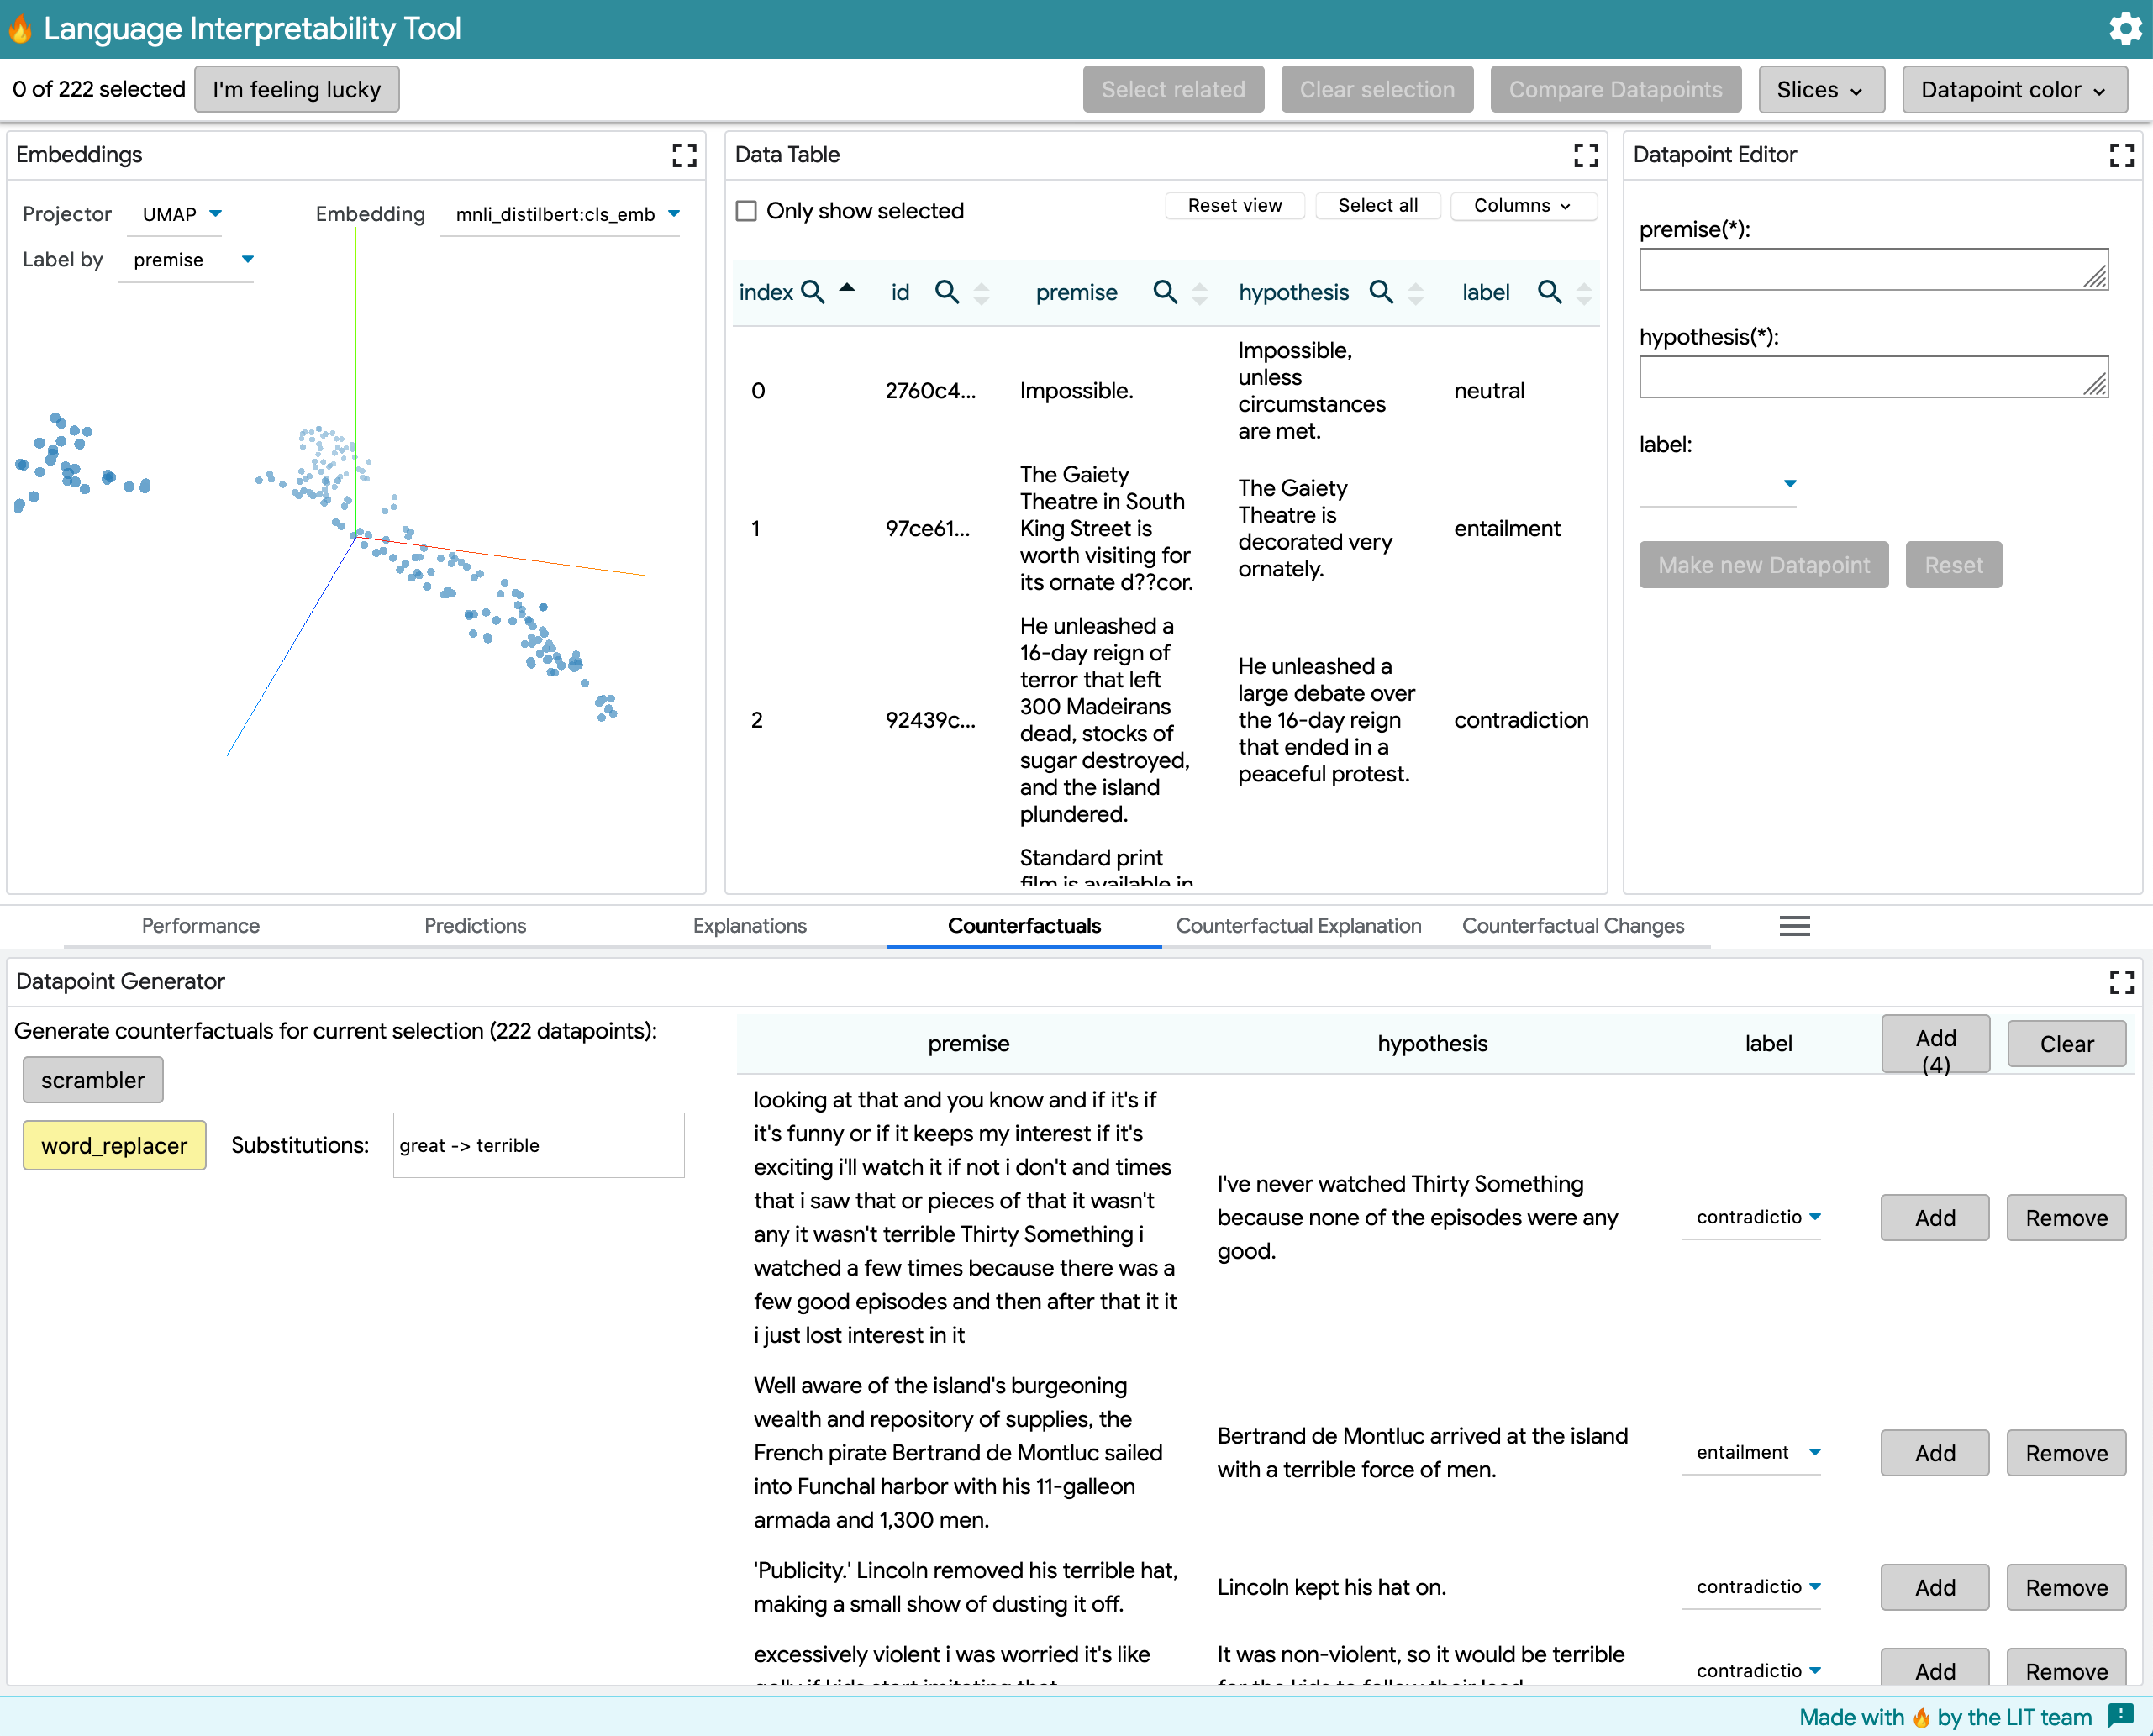
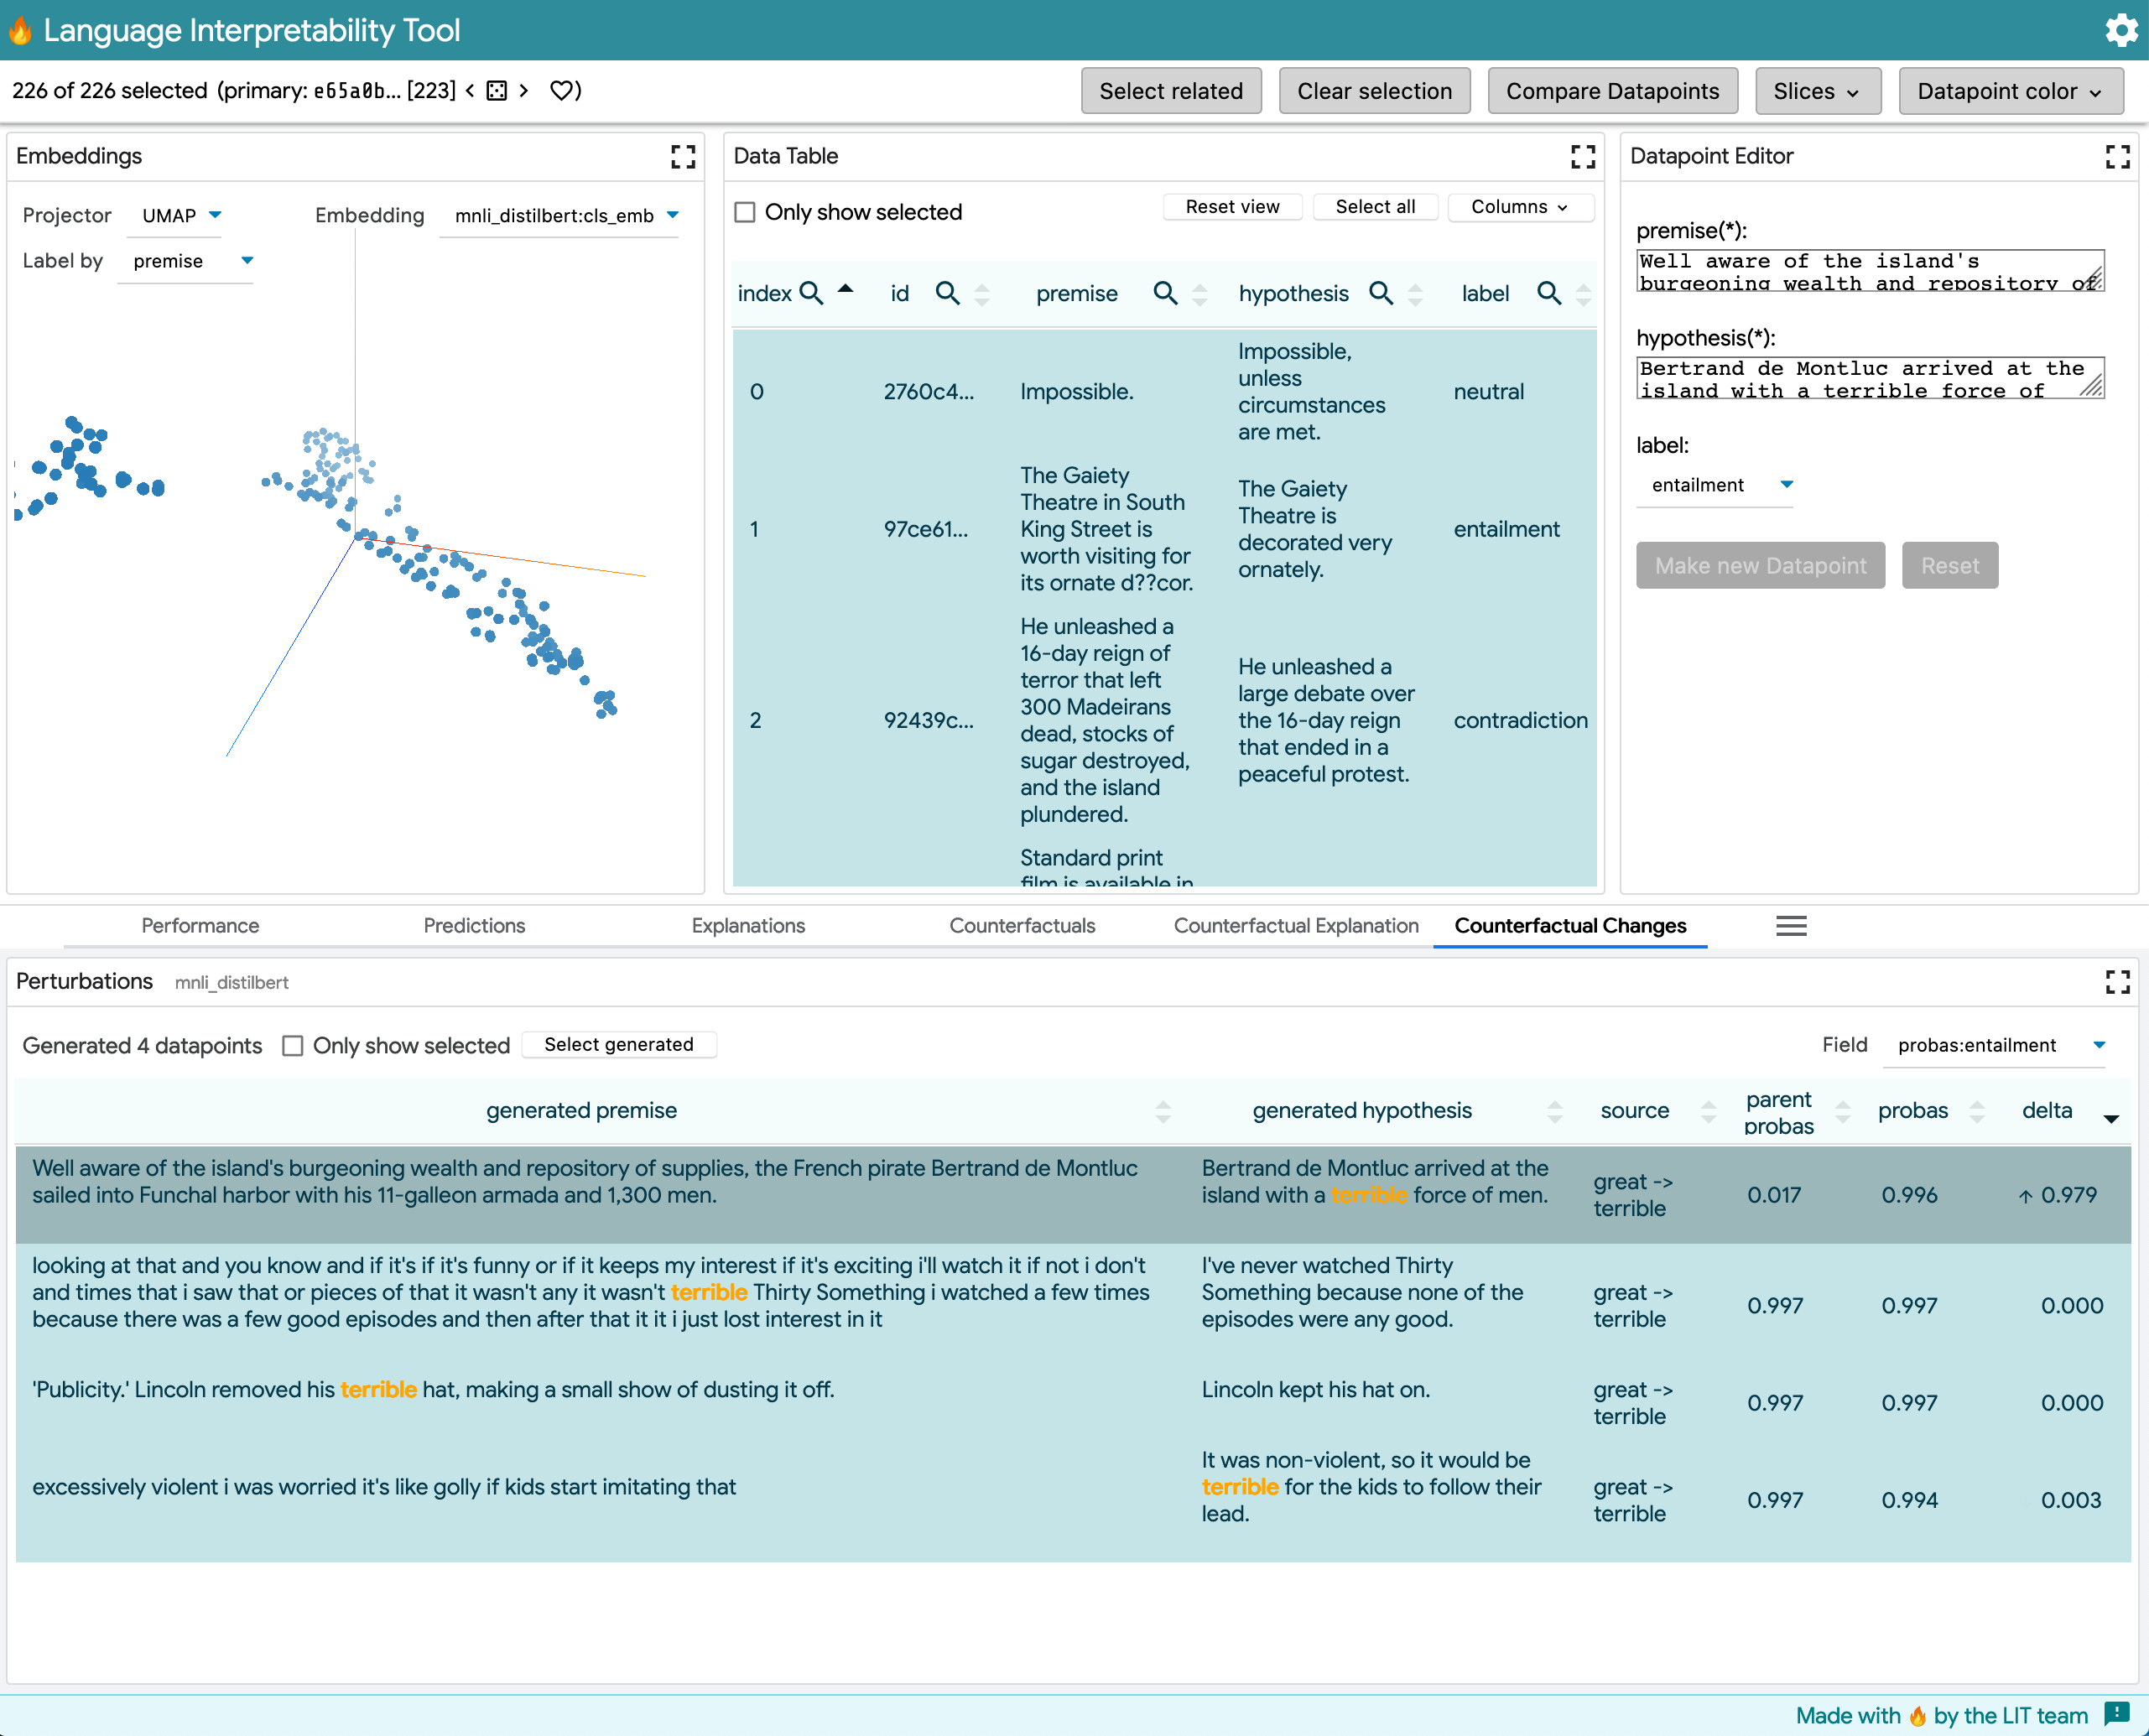
MNLI, multiclass classification:
This model outputs a MultiClassPreds with [entailment, contradiction, neutral] prediction labels, given an input with premise and hypothesis sentences. The example shows word_replacer changing great -> terrible (although this generator makes less sense for MNLI). Note the dropdown in the upper right of the table that allows switching prediction labels .
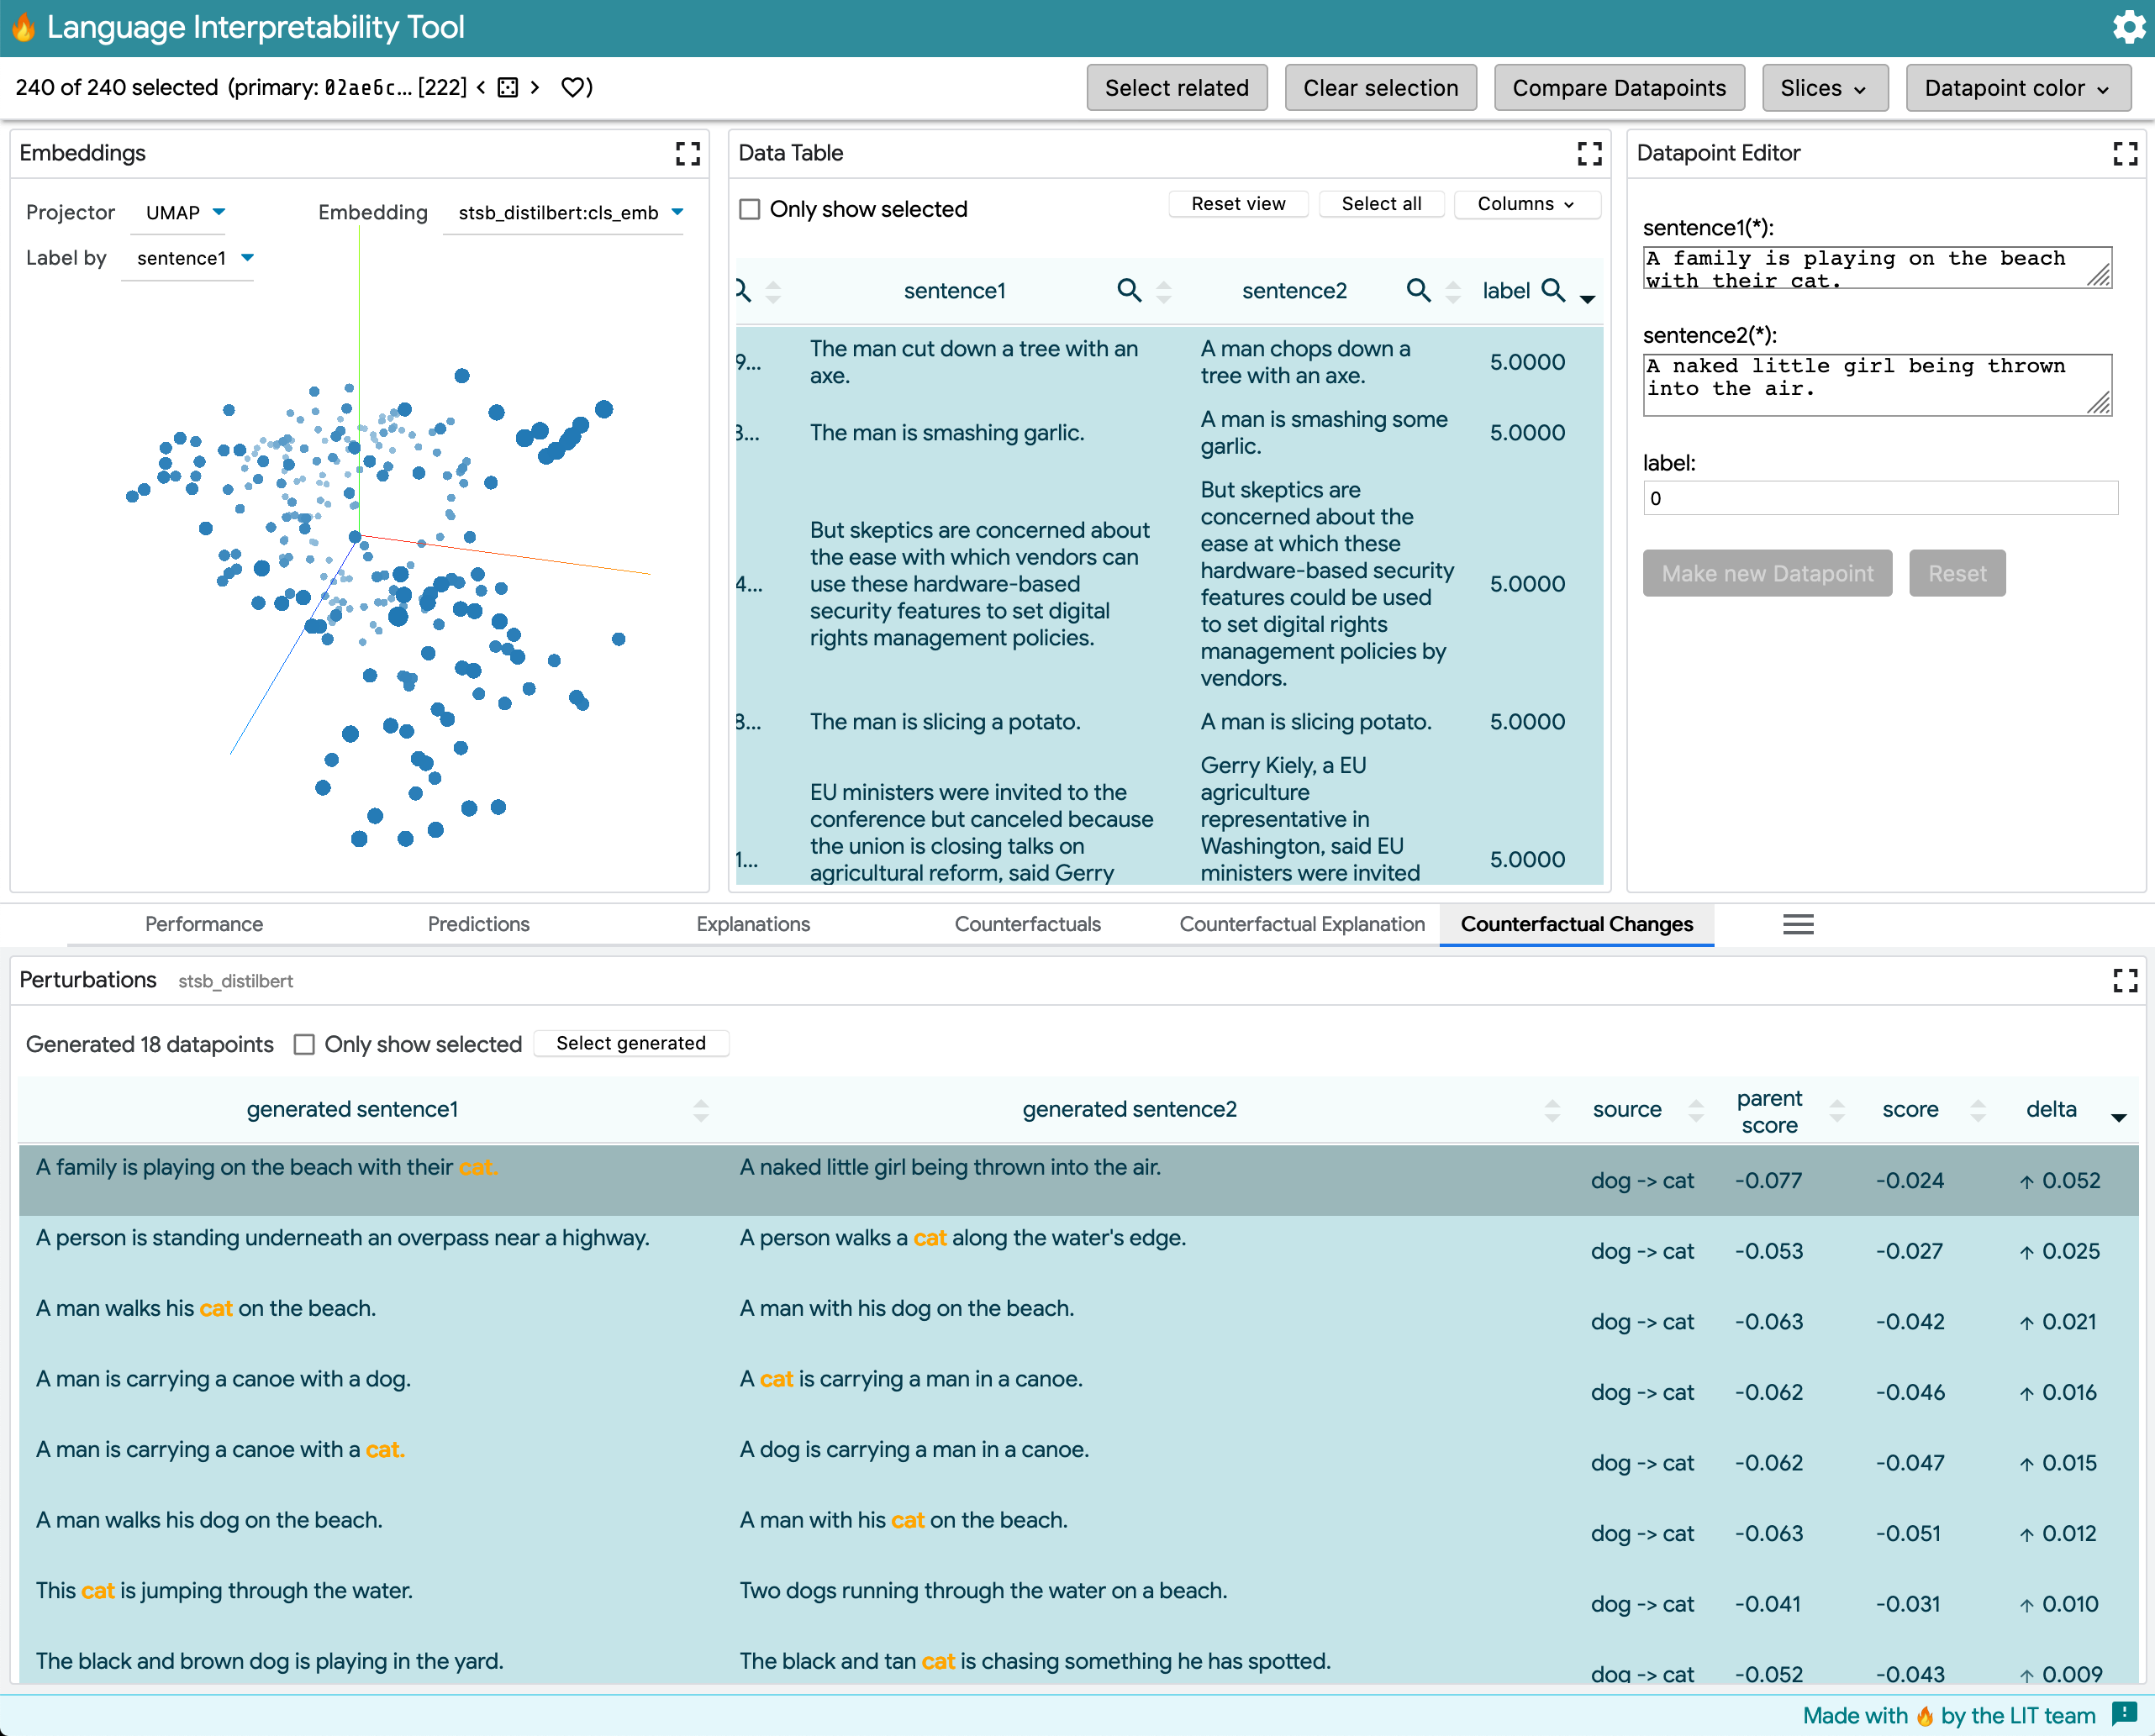
STSB, regression:
This model outputs a RegressionScore from [0, 5]. The example shows using word_replacer to change dog -> cat.
UX notes:
- The table lists sentences, sorted by the largest delta from before the generator -> after. Sentences are highlighted using the same "by word" method from difflib.
- If there are multiple scores available for the model, the first is shown by default. A dropdown at the above right of the table allows switching to another score (eg, for multiclass predictions).
- Selection and table sorting works as expected.
- Arrows indicate direction of the delta, with opacity doubly encoding the magnitude of the change relative to all deltas in the set.
Critiques: A. This doesn't help understand the whole distribution (ie, a visual representation would help as another module).
Multiple models
This shows comparing distilbert-base-uncased-finetuned-sst-2-english to textattack/roberta-base-SST-2, both trained and evaluated on the same SST dataset. Here you can see how the same perturbations changed classification performance on each model. Depending on what the user selects and how they sort, they can either look at "what examples changed most across each model" or "how do the selected examples differ across models."
Other engineering changes
DeltaService
Adds this to figure out what fields to read, and to compute deltas for them. Can be used by another chart widget in a subsequent pull request.
StateService
Adds in dependency on uuid, and generates a uuid for tracking which call to the generator created the data point, and allow callers to store a text value for the rule. This is done a bit as a workaround since the meta dictionary isn't part of the model's output spec, but alternately we could add this server side, but it seemed more complicated to try to fit this into _get_datapoint_ids.
lit-text-diff
This is factored out from GeneratedTextModule, so it can be reused in a slightly different context here. This involves adding params to disable the labels, and to show only one sentence of the diff. I moved the related test for getTextDiff over as well without any other changes, but didn't actually run them (adding jasmine-ts didn't just work, and I didn't look further).
lit-data-table
- Allow
TemplateResultin table cells (highlight changes the generator made, add delta arrow icons). - Abstract looking up data index for a row (column was hardcoded, previously marked TODO).
- Support an initial sort column and direction (sort by delta in descending order).
- Allow sort values to differ from display in cells (sort by sentence text, delta numeric value).
- Support sizing the height when the controls are disabled.
EDIT: I updated the way setting the default sort works to remove the manual call to requestUpdate, and tried to do this by making a minimal set of changes to how the table component worked (on its own commit). I also looked at supporting a more generic way for sorting TemplateResult columns but this felt too complicated - you can't just render it in-memory with lit-html and grab the text, since it won't know how to understand custom lit-element tags, let alone icon fonts :) Instead, I removed the extra columns so there's only one for the id, and then the caller keeps a map to look that up and do sorting that way.
other bits
- pull
formatLabelNumberout from metrics UI intoutil(reuse it for formatting) - pull
selectedRowIndicesout from data table UI intoselectionService(reuse it for tracking selection) - add in a selector to
sharedStylesthat allows consumers to opt-out of styling for<button/>elements
counterfactuals
- add
meta.creationIdfield (to group datapoints into the set created by a specific call to a generator)
I pushed two commits that try to clean up the changes made to the lit-data-table (see EDIT note in description for more).
And two more commits to improve the layout when there are multiple models or fields.
@jameswex This is ready for another look, or @iftenney if you have other comments please feel free to chime in as well! 👍
I realized this module was implicitly relying on the Prediction Score module to ensure that predictions are fetched when new perturbations are generated. So I pushed a commit that factors that fetching out from prediction_score_module and into predictions_service, so this module can explicitly wait for the prediction and re-use the same fetching logic. This could probably benefit from a cross-module cache (as some comments suggest, but I didn't change that).
@jameswex @iftenney Also, I'm just gonna leave those merge conflicts be for now, hold back the pull request for adding the chart, and wait until you give the 🟢 to move forward. If you'd prefer that I close this and instead batch it up with the chart in one larger PR so there's only one PR to review & manually test, I'm happy to do that too. Let me know what's easier for you all whenever you're ready 👍
Thanks!