Neuraxle v.s. Scipy's `LogUniform` distribution for ANNs' learning rates: which is the good one? + check LogNormal as well
Is your feature request related to a problem? Please describe. I think that there is either an error with Neuraxle's LogUniform, or else with scipy's LogUniform.
Describe the solution you'd like The LogUniform distribution should be the good one for a learning rate, and I believe it's inverse " 1 / · " distribution should be the same and that this is the good mathematical test to verify that the distribution is the good one. Same for LogNormal
Ultimately I want a simple to use distribution such as LogUniform(0.001, 0.1) whereas the learning rate would be allowed to take values loguniformally between 0.001 to 0.1 simply with those easy to read and easy to change arguments.
Describe alternatives you've considered
- See my comment here on the relevant scipy issue thread: https://github.com/scipy/scipy/pull/10815#issuecomment-574387083
- I firmly believe my way of proceeding is the right one due what I've written here in 2017 at Vooban under the subtitle
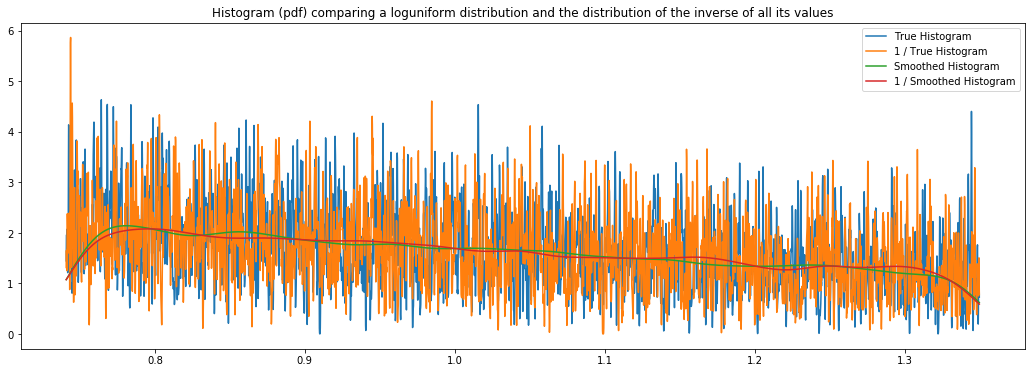
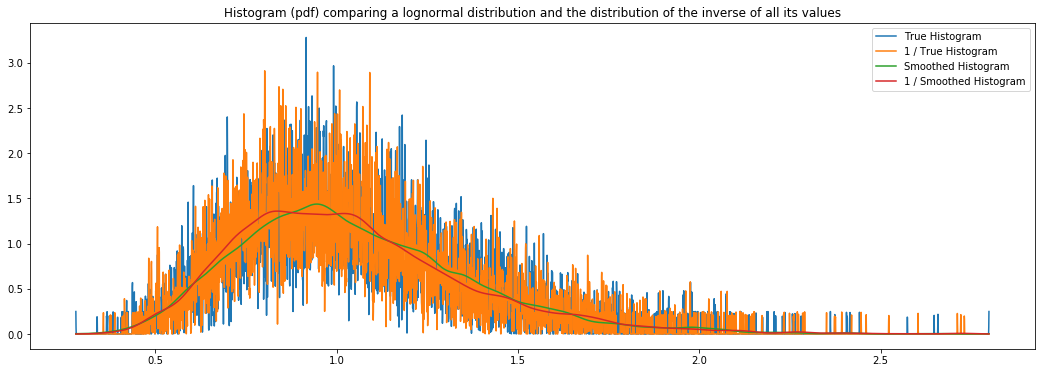
On the loguniform and lognormal distributionswhereas I've validated plotting the inverse " 1 / · " distributions of hyperopt, and whereas I've did this validation with scipy and Neuraxle's distributions and Neuraxle's distribution was effectively the good one.
Additional context Here is the code from the Vooban article (note: the following code is licensed under this MIT License) where Hyperopt's LogUniform and LogNormal are investigated and looks right according to my plotting test:
log_hyperparam_generators = {
    'loguniform': hp.loguniform('loguniform', -0.3, 0.3),
    'lognormal': hp.lognormal('lognormal', 0, 0.3)
}

# For more info about the lognormal distribution, see:
# https://www.wolframalpha.com/input/?i=y%3D2%5E(+(-log4(x))%5E0.5+),+y%3D2%5E(-+(-log4(x))%5E0.5+)+from+0+to+1
# https://www.wolframalpha.com/input/?i=y%3D4%5E-(log2(x)%5E2)+from+0+to+5

n_samples = 5000

for title, space in log_hyperparam_generators.items():
    evaluated = [
        pyll.stochastic.sample(space) for _ in range(n_samples)
    ]
    inverse_evaluated = [1.0 / y for y in evaluated]
    x_domain = np.linspace(min(evaluated), max(evaluated), n_samples)

plt.figure(figsize=(18,6))
hist = gaussian_kde(evaluated, 0.001)
plt.plot(x_domain, hist(x_domain), label="True Histogram")

inverse_hist = gaussian_kde(inverse_evaluated, 0.001)
plt.plot(x_domain, inverse_hist(x_domain), label="1 / True Histogram")

blurred_hist = gaussian_kde(evaluated, 0.1)
plt.plot(x_domain, blurred_hist(x_domain), label="Smoothed Histogram")

blurred_inverse_hist = gaussian_kde(inverse_evaluated, 0.1)
plt.plot(x_domain, blurred_inverse_hist(x_domain), label="1 / Smoothed Histogram")

plt.title("Histogram (pdf) comparing a {} distribution and the distribution of the inverse of all its values".format(title))
plt.legend()
plt.show()
See full code here: https://github.com/guillaume-chevalier/Hyperopt-Keras-CNN-CIFAR-100/blob/Vooban/IntroductionToHyperopt.ipynb
Scipy stats reciprocal is really a log-uniform, but they parametrize it differently than us. The way we parametrize it is that we output directly the min and max in the logUniform that is see visually and same thing for the logNormal, because of the log2(min) and log2(max) or log2_space_mean and log2_space_scale.
So in order for both distribution to be equivalent you have to parametrize correctly the scipy.stats reciprocal distribution.
@Eric2Hamel Unless I'm mistaken, I think I tested the reciprocal of scipy on the charts here and the red line couldn't kiss the green line in doing so, which would suggest that the reciprocal of scipy isn't good.
Why did you use the inverse in your plot? What is the difference between True Histogram and smoothed? Not sure to correctly understand what you are testing in your plot.
The true way to test if a logUniform is to take the log (using same base) of the sample and validating that you are uniform. LogUniform have is name because you are uniform in the log space. Which scipy seams to have done in there forum and show you a graph which is pretty uniform.
This issue has been automatically marked as stale because it has not had recent activity. It will be closed if no further activity occurs in the next 180 days. Thank you for your contributions.