Top workloads per delay center graph
In Perf archives (PAS), there is the delay center view, and it is possible to get the top workloads per delay center (measured by latency somehow, probably have to get with PAS dev team). In perfstat, we have stats resource_detail. In default perf archive data, resource_detail is not available, but in theory could be calculated from the latency metrics like PAS.
The request is a view showing the top workloads per delay center (cpu dblade/cpu nblade/disk/etc.).
Why is this? Because there is no way to really get a listing of top workloads today in AIQUM or Harvest historically, unless a customer sets up a script to log stats resource_detail and parses it.
-Paul Stejskal
I'm not familiar with how to create dashboards or metrics manually. If someone can maybe show me how or get me started, I could see what is possible?
@MrObvious Workload counters are available here. You will need to uncomment these and restart harvest. For resource level metrics, it is workload_detail and workload_detail_volume templates. These counters are available through volume dashboard in harvest.
Hmm. I edited /opt/harvest2-conf/zapiperf/conf/default.yaml but don't see it yet. Should I see it somewhere? I'm on Discord/Teams if you wish to interact directly.
@MrObvious Yes sure let's connect on harvest channel on discord. Could you check the logs in case there are any errors or permission issue.
As discussed, NABox is resetting the default.yaml file on restart. You can place these objects in custom.yaml, That should work.
It is already included in the upcoming releases with the workload counters, but I think it needs it's own panel or clarification. Basically this is the way PAS calculates top cloud i/o workloads: "The formula used is: per workload time in given delay center / total time for the given delay center * 100."
This may come from workload_queue_nblade/dblade counters I believe instead of workload_detail_volume.
@MrObvious Sure we'll take a look. Harvest exposes these metrics as qos_detail_resource_latency with labels as resource like below. Let us know if counters values are different in PAS.
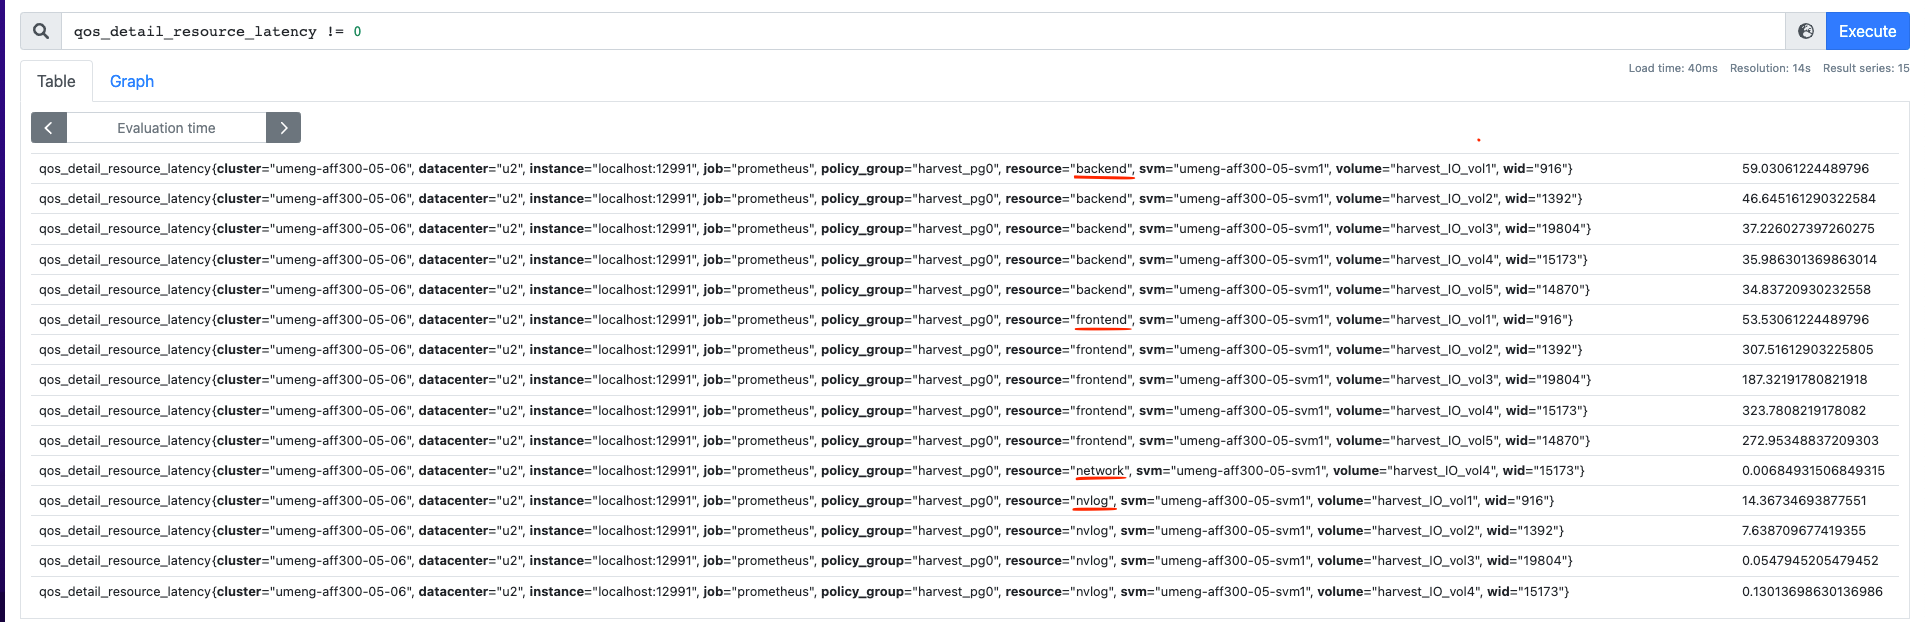
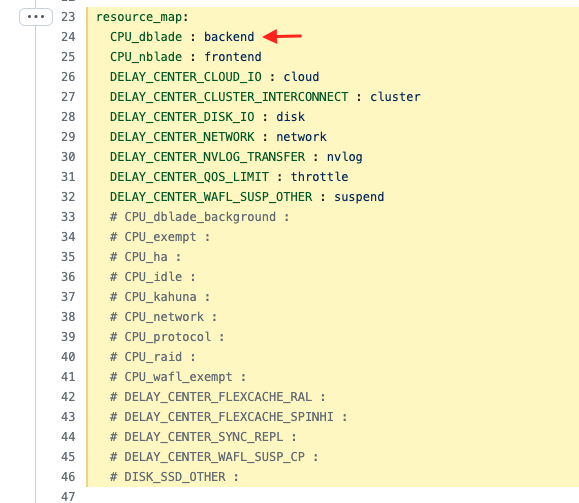
These resources are renamed in template here which can be changed as per the need. https://github.com/NetApp/harvest/blob/main/conf/zapiperf/cdot/9.8.0/workload_detail_volume.yaml#L23-L46
From example as per below screenshot. Resource CPU_dblade will come as backend in harvest as label.
Yes that should do nicely. If it was a separate view I think this ask would settle the "top workloads using ____ resource" questions. For example: https://github.com/NetApp/harvest/issues/1161 is essentially a duplicate of this ticket.
I think #1161 is different as it needs topk volumes at aggr level and not at node level.