[BUG] Sentry tracing doesn't work for open lineage API.
Sentry trace does not show details for open lineage API. Other API shows breakdown for each DAOs, but OpenLineage API only shows the high level performance but no breakdown.
I spent a bit of time trying to diagnose why Sentry traces don't work in the OpenLineage API.
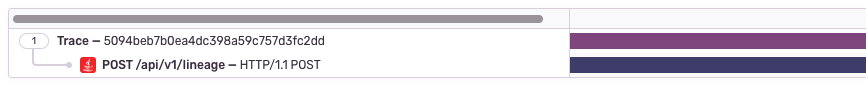
Seems Sentry uses a threadlocal stack to manage Spans. Even though we create a new span and set the transaction to the original thread's transaction, the created span is never associated with the parent span - thus we get this graph:
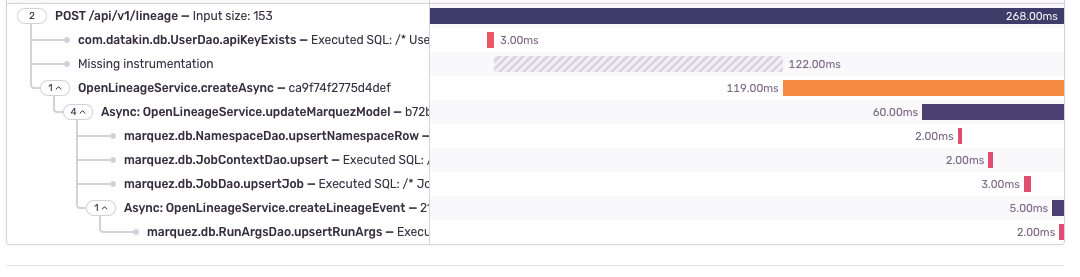
I tried updating the code to update the threadlocal stack with the request thread's stack, which works, except that when two threads are simultaneously running, new spans get interleaved with ones running in the other thread
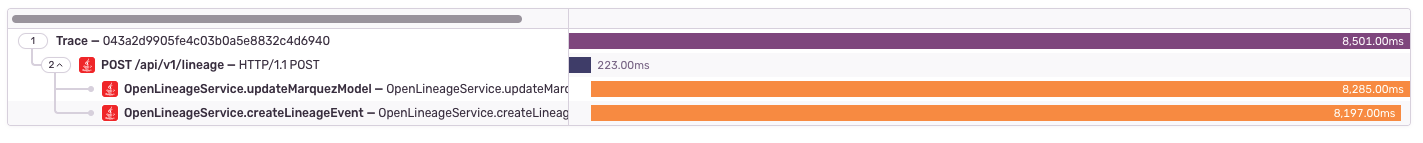
So then I tried creating a SentryTraceHeader, which is used to persist traces across services, and change the code to create a new transaction from the parent trace. This works, but we get kind of a funny view - the original request shows the two asynchronous requests, but in the main view, we can't see what's going on inside those two spans.
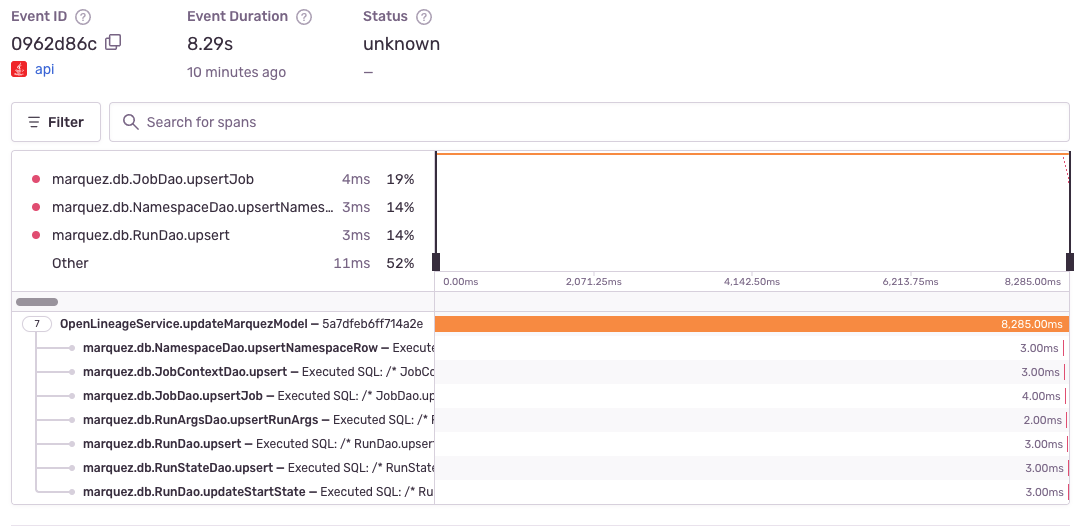
We can click on each span and "view transaction" to see the actual breakdown of each async request -
I don't know if there's a more correct way of handling this - the Sentry docs don't talk about threading AFAICT
To get the graphs in the last example, I used this code
  private static class SentryScope {

    private final String operation;
    private final SentryTraceHeader traceContext;
    private ITransaction transaction;

    SentryScope(String operation) {
      this.operation = operation;
      traceContext = Sentry.getSpan().toSentryTrace();
    }

    void startSpan() {
      if (traceContext != null) {
        Sentry.getCurrentHub().pushScope();
        transaction = Sentry.startTransaction(
            TransactionContext.fromSentryTrace(operation, operation, traceContext)
        );
        Sentry.configureScope(scope -> scope.setTransaction(transaction));
      }
    }

    void endSpan() {
      if (transaction != null) {
        transaction.finish();
      }
    }
  }