SimpleTensor
 SimpleTensor copied to clipboard
a simple demo to implement a deep learning frame based on static graph
SimpleTensor
SimpleTensor is a quite simple demo to implement a deep learning frame based on static graph.
I have reconstructed the project in order to make it more like a Python project.
Besides, in order to make you more willing to read the source of SimpleTensor and try to understand stable framework like TensorFlow, I have written blog in my Zhihu Column.
This is a try to implement my own framework, my purpose is to have fun when developing and deploying DNN to my server or embedded device. Afterwards, I am to use C++11 and Pybind11 to accelerate it.
Have fun!
Feature
- It is quite light, so you can use it with limited resource(maybe...)
- It is a good demo to learn how deep learning framework like
TensorFlowworks
TODO
- [ ] support 2D conv
- [ ] support RNN
- [ ] resolve the unstable calcualtion problem
- [x] reconstruct by ABC
- [ ] reconstruct by C++/PyBind11
- [ ] support JIT
- [ ] lazy module (predefined training pipeline)
- [ ] support ONNX
Quick Start
I am going to presenting how the cake is baked instead of being going to tell you how to use it.
import SimpleTensor as st
from SimpleTensor.view import view_graph
from sklearn.datasets import load_iris
from sklearn.metrics import accuracy_score
import matplotlib.pyplot as plt
import pandas as pd
import numpy as np
import seaborn
train_X = pd.read_csv("./train_feature.csv", header=None).to_numpy().astype("float32")
train_Y = pd.read_csv("./train_target.csv", header=None).to_numpy()
train_X = (train_X - train_X.min(axis=0)) / np.ptp(train_X, axis=0)
label = st.numpy_one_hot(train_Y)
X = st.Placeholder()
Y = st.Placeholder()
out1 = st.dnn.Linear(2, 2, act="sigmoid")(X)
loss = st.measure.CrossEntropy(reduction="mean")(predict=out1, label=Y)
session = st.Session()
optimizer = st.optimizer.SGD(learning_rate=1e-2)
losses = []
acces = []
for epoch in range(10):
session.run(root_op=loss, feed_dict={X : train_X, Y : label})
optimizer.minimize(loss)
pre_lab = np.argmax(out1.numpy, axis=1)
acc = accuracy_score(train_Y, pre_lab)
print(f"\033[32m[Epoch:{epoch}]\033[0m loss: {loss.numpy} accuracy: {acc}")
losses.append(loss.numpy)
acces.append(acc)
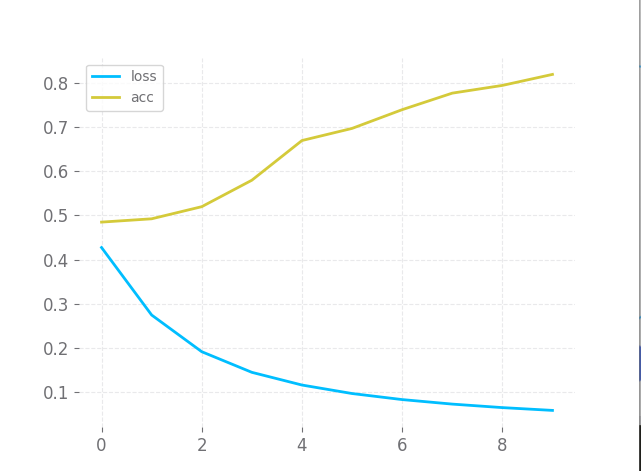
plt.style.use("gadfly")
plt.plot(losses, label="loss")
plt.plot(acces, label="acc")
plt.legend()
plt.show()
view_graph(format="pdf", direction="LR", show_grad=True)
out:
[Epoch:3] loss: 0.1442941961993224 accuracy: 0.58
[Epoch:4] loss: 0.11548863428827694 accuracy: 0.67
[Epoch:5] loss: 0.09622477471322295 accuracy: 0.6975
[Epoch:6] loss: 0.08250049345115562 accuracy: 0.74
[Epoch:7] loss: 0.0722454551934368 accuracy: 0.7775
[Epoch:8] loss: 0.06429741413187236 accuracy: 0.795
[Epoch:9] loss: 0.05795802584758128 accuracy: 0.82
Log
-
It's
2021.2.18, I haven't finishedOperationof CNN, RNN and transformer, which might make some audience disappointed. Fine, give me a chance and I will implement the lovely API after I finish my second track of my album :D -
It's
2022.3.13. Wow, one year has passed and I almost do nothing on the project! Fine, I will reconstruct it with more advanced tech! -
It's
2022.3.14. I fixed the major problem hidden in my framework.- I forget to use one hot encoding to encode the input label.
- The loss decreases quite slow. By visualization gradient then I found that mean operation has been
Metadata
Owner
Metadata
a simple demo to implement a deep learning frame based on static graph