lets-plot
 lets-plot copied to clipboard
Multiplatform plotting library based on the Grammar of Graphics
As docstring said None can be passed as lower/upper bound: > xlim : list > Limits (2 numbers) for the x axis. > 1st element defines lower limit, 2nd element...
The output for 10000 days duration is weird: 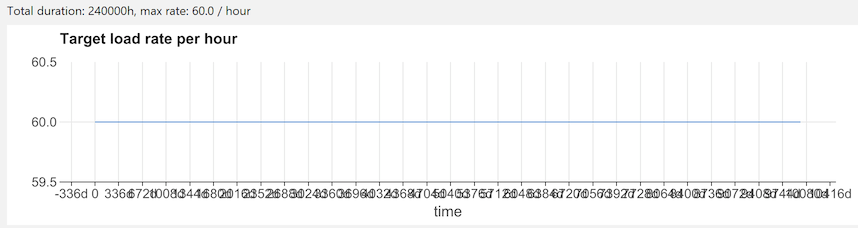 See: https://github.com/JetBrains/lets-plot/issues/470#issuecomment-993844170

Hello, lets-plot used to work on Databricks with DBR 10.x (cluster version) and lower and we have customers who love and use it. However, with DBR 11.x the auto-renderer breaks...
Currently the following `geom_label` parameters are not supported in livemap: `label_padding` - amount of padding around label; `label_r` - radius of rounded corners; `label_size` - size of label border.
Example: ``` data = { "alphabet": ["a","a","b","a","a","a","b","b","b","a","a","a"], "coeff": [ 0.9898989898989898, 0.98989898989899, 0.9871794871794872, 0.9916666666666667, 0.9882352941176471, 0.9947368421052631, 0.9916666666666667, 0.9882352941176471, 0.9947368421052631, 0.9916666666666667, 0.9882352941176471, 0.9947368421052631 ] } ggplot(data) + geom_boxplot(aes("alphabet", "coeff"), orientation="y") ``` Result:...
It seems that ggsave in [lets-plot-kotlin](https://github.com/JetBrains/lets-plot-kotlin#export) supports more file formats like png and jpeg. Is there a specific problem with the python version for not supporting these formats?
Add a save convenience method to the PlotSpec class. Now we have the ggsave(plot, ...) method. For convencience it would be great if we would add a ggsave() or save()...
hello, how to use lets-plot in compose for desktop?
It would be helpful to have the ability to add custom point shapes (by providing an SVG of them, for example).