lets-plot

lets-plot copied to clipboard
scale_alpha: conflict of constant and mapped values of alpha aesthetic
Minimal reproducible example:
data = {
    'x': [-3, -2, -1, 0, 1, 2, 3],
    'y': [-3, -2, -1, 0, 1, 2, 3],
    'v': [-9, -4, -1, 0, 1, 4, 9],
}
ggplot(data, aes('x', 'y')) + \
    geom_point(size=10, alpha=.5) + \
    geom_point(aes(alpha='v'), color="black") + \
    scale_alpha(trans='log10')
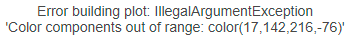
Output:
Output of ggplot2 with similar code:

It warns, but works.
Output of Lets-Plot, when trans='sqrt' (near to expected behaviour):
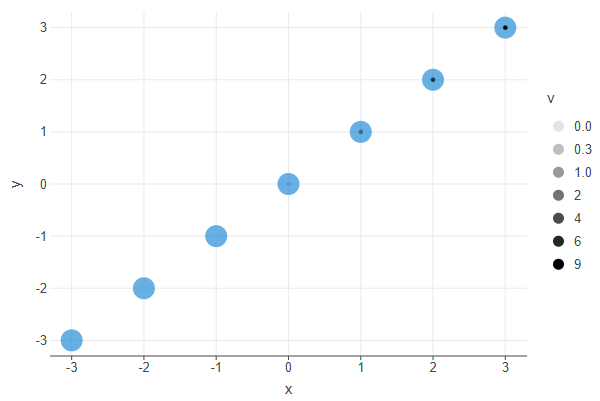
Output of Lets-Plot, if we remove alpha=.5 from the first layer:

So it also works somehow. It means that the library actually knows how to deal with negative values when log10 transformation is applied. The key point - constant value of the alpha parameter in the first layer.