lets-plot

lets-plot copied to clipboard
geom_text(): Labels do not fit plot boundaries
from lets_plot import *
LetsPlot.setup_html()

data = {'x': [0, 1], 'y': [0, 1], \
        'text': ['Lorem ipsum #1', 'Lorem ipsum #2']}

ggplot(data, aes('x', 'y')) + geom_text(aes(label='text'))
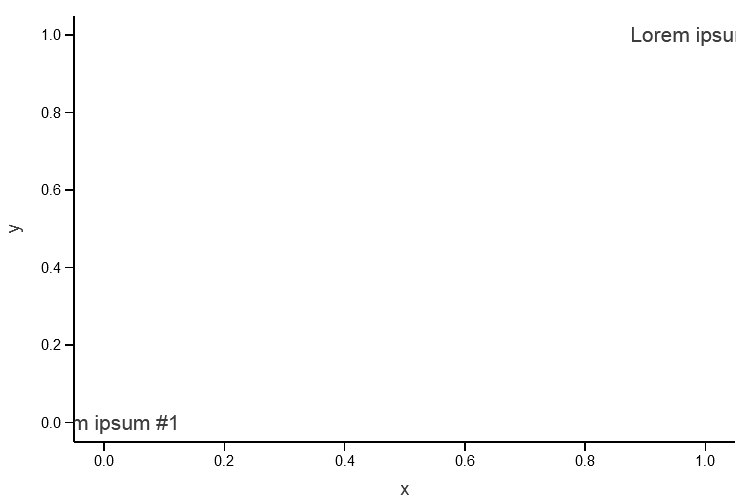
According to ggplot2 docs
axis limits are not automatically expanded to include all text.
Therefore we might have the correct behavior here.