P2G error with addPermutedPval
Hi @rcorces, I tried using this approcah but ended up with this error:
devtools::install_github("GreenleafLab/ArchR", ref="dev", repos = BiocManager::repositories()) proj <- addPeak2GeneLinks(ArchRProj = proj,maxDist = 500000,addPermutedPval = TRUE,nperm = 100) ArchR-addPeak2GeneLinks-4efe4aee7bee-Date-2022-12-04_Time-00-12-06.log
ArchR logging to : ArchRLogs/ArchR-addPeak2GeneLinks-4efe4aee7bee-Date-2022-12-04_Time-00-12-06.log If there is an issue, please report to github with logFile! 2022-12-04 00:12:06 : Getting Available Matrices, 0.005 mins elapsed. 2022-12-04 00:16:18 : Filtered Low Prediction Score Cells (29695 of 201735, 0.147), 0.022 mins elapsed. 2022-12-04 00:16:25 : Computing KNN, 0.14 mins elapsed. 2022-12-04 00:16:30 : Identifying Non-Overlapping KNN pairs, 0.218 mins elapsed. 2022-12-04 00:16:33 : Identified 500 Groupings!, 0.262 mins elapsed. 2022-12-04 00:16:33 : Getting Group RNA Matrix, 0.264 mins elapsed. 2022-12-04 00:28:03 : Getting Group ATAC Matrix, 11.761 mins elapsed. 2022-12-04 00:42:17 : Normalizing Group Matrices, 26.003 mins elapsed. 2022-12-04 00:42:32 : Finding Peak Gene Pairings, 26.25 mins elapsed. 2022-12-04 00:42:34 : Computing Correlations, 26.285 mins elapsed. Performing Permuted P-values similar to Regner et al., 2021 Running Permutation 1 of 100 Error in [[<-(tmp, name, value = numeric(0)) : 0 elements in value to replace 5439471 elements Calls: addPeak2GeneLinks -> $<- -> [[<- -> [[<- Execution halted
Hi @AnjaliC4! Thanks for using ArchR! Please make sure that your post belongs in the Issues section. Only bugs and error reports belong in the Issues section. Usage questions and feature requests should be posted in the Discussions section, not in Issues.
Before we help you, you must respond to the following questions unless your original post already contained this information:
1. If you've encountered an error, have you already searched previous Issues to make sure that this hasn't already been solved?
2. Can you recapitulate your error using the tutorial code and dataset? If so, provide a reproducible example.
3. Did you post your log file? If not, add it now.
4. Remove any screenshots that contain text and instead copy and paste the text using markdown's codeblock syntax (three consecutive backticks). You can do this by editing your original post.
Hi @rcorces, I think we have found the error. Its really simple so if you can please change this in the dev branch today I would really really appreicate it https://github.com/GreenleafLab/ArchR/blob/dev/R/IntegrativeAnalysis.R#L1307 o$PermPval <- o$PvalPerm + p$Pval o$PvalPerm to o$PermPval
I think this should resolve it. Thanks.
fixed via https://github.com/GreenleafLab/ArchR/commit/767d272571b2e65fcfdd455045914bb66c50195f thanks for finding the typo
If this fixes your problem, please go ahead and close the issue
Hi @rcorces,
We also found out that current version of the same function does not provide a way to export PermPVal and PermFDR.
We think this will be resolved if you change o$PermPval and o$PermFDR to out$PermPVal and out$PermFDR.
In addition, I think it would be very helpful to return the mean Null correlation values per peak-to-gene linkages in "out$NullCorrelation" to compare null correlations with significant correlations.
Thank you!
I'll need a few days to make this happen. Can you clarify what you mean by the null correlations? Do you just want me to copy this line to be returned when addPermutedPval = TRUE?
https://github.com/GreenleafLab/ArchR/blob/767d272571b2e65fcfdd455045914bb66c50195f/R/IntegrativeAnalysis.R#L1289
Hi @rcorces,
I guess the main issue is simple which is changing o$PermPval and o$PermFDR to out$PermPVal and out$PermFDR. This will allow us to work with significant correlations. If you can please make this change earlier than I can test if we are getting the PermPval in the output.
For my request, I was referring to getting the mean permuted correlations across the 100 permutations in "out".
https://github.com/GreenleafLab/ArchR/blob/767d272571b2e65fcfdd455045914bb66c50195f/R/IntegrativeAnalysis.R#L1303
I think we would need to add p$Correlation in a new variable (o$nullCorrelations) similar to o$PermPval and output the mean correlations in out$meanNullCorrelations. This is simply to compare permuted correlations with significant correlations. This is based on discussion: https://github.com/GreenleafLab/ArchR/discussions/1149#discussioncomment-4334785
I've created a new branch called dev_p2g to hold these changes and made the suggested change to save the PermPval and PermFDR in the output. Will look into the null correlations later.
@AnjaliC4 - In my haste to implement your request I didnt do things correctly. I've revisited this and implemented all of the changes that you requested including the null correlations via https://github.com/GreenleafLab/ArchR/commit/25a854ffad5136f44fa7372eb5d35ce7b31d538c
I'll admit that I'm still not 100% sure that what I've done is what you are asking for. I would appreciate it if you could take a look.
@RegnerM2015 - if you have a chance to review this as well, that would be greatly appreciated.
These changes are currently stored on the dev_p2g branch.
> projHeme5 <- ArchR::addPeak2GeneLinks(
+   ArchRProj = projHeme5,
+   reducedDims = "IterativeLSI",
+   addPermutedPval = TRUE,
+   nperm = 10
+ )
ArchR logging to : ArchRLogs/ArchR-addPeak2GeneLinks-2f9ea3504c0d67-Date-2022-12-19_Time-13-40-19.log
If there is an issue, please report to github with logFile!
2022-12-19 13:40:20 : Getting Available Matrices, 0.017 mins elapsed.
2022-12-19 13:40:23 : Filtered Low Prediction Score Cells (1356 of 10250, 0.132), 0.023 mins elapsed.
2022-12-19 13:40:24 : Computing KNN, 0.043 mins elapsed.
2022-12-19 13:40:24 : Identifying Non-Overlapping KNN pairs, 0.045 mins elapsed.
2022-12-19 13:40:34 : Identified 490 Groupings!, 0.203 mins elapsed.
2022-12-19 13:40:34 : Getting Group RNA Matrix, 0.204 mins elapsed.
2022-12-19 13:40:51 : Getting Group ATAC Matrix, 0.495 mins elapsed.
2022-12-19 13:41:10 : Normalizing Group Matrices, 0.807 mins elapsed.
2022-12-19 13:41:14 : Finding Peak Gene Pairings, 0.874 mins elapsed.
2022-12-19 13:41:14 : Computing Correlations, 0.879 mins elapsed.
Performing Permuted P-values similar to Regner et al., 2021
Running Permutation 1 of 10
Running Permutation 2 of 10
Running Permutation 3 of 10
Running Permutation 4 of 10
Running Permutation 5 of 10
Running Permutation 6 of 10
Running Permutation 7 of 10
Running Permutation 8 of 10
Running Permutation 9 of 10
Running Permutation 10 of 10
2022-12-19 13:42:41 : Completed Peak2Gene Correlations!, 2.317 mins elapsed.
ArchR logging successful to : ArchRLogs/ArchR-addPeak2GeneLinks-2f9ea3504c0d67-Date-2022-12-19_Time-13-40-19.log
> p2g <- getPeak2GeneLinks(
+     ArchRProj = projHeme5,
+     corCutOff = 0.45,
+     resolution = 1,
+     returnLoops = FALSE
+ )
> p2g
DataFrame with 39363 rows and 9 columns
        idxATAC    idxRNA Correlation          FDR  VarQATAC   VarQRNA PermCorrelation  PermPval   PermFDR
      <integer> <integer>   <numeric>    <numeric> <numeric> <numeric>       <numeric> <numeric> <numeric>
1            38         2    0.547094  4.01302e-38  0.838919  0.452126      0.01806450  0.475422         0
2            11         3    0.493587  3.66743e-30  0.922478  0.481211     -0.00818977  0.602969         0
3            51         4    0.452546  5.96334e-25  0.423078  0.364604      0.01445345  0.366519         0
4             3         6    0.567426  1.50370e-41  0.279235  0.483522      0.01521130  0.391266         0
5            61         6    0.492354  5.38928e-30  0.903450  0.483522      0.00453535  0.418652         0
...         ...       ...         ...          ...       ...       ...             ...       ...       ...
39359    142443     18588    0.884094 5.73980e-160  0.794596  0.379066      0.00897818  0.505939         0
39360    142444     18588    0.565647  3.06978e-41  0.327250  0.379066     -0.00869699  0.521333         0
39361    142433     18590    0.533444  5.93603e-36  0.559986  0.958443      0.00510259  0.517811         0
39362    142443     18590    0.663546  1.42706e-61  0.794596  0.958443     -0.00181372  0.633850         0
39363    142443     18591    0.474466  1.20547e-27  0.794596  0.953981      0.01357638  0.688180         0
Hi @rcorces,
While I have not yet had the chance to run this new implementation from the dev_p2g branch, I do have some follow up questions just to clarify and to improve my own understanding of the implementation.
-
Can you confirm that this line in the permutation for loop is necessary? It seems like
cdfis not used after the permutation for loop. https://github.com/GreenleafLab/ArchR/blob/25a854ffad5136f44fa7372eb5d35ce7b31d538c/R/IntegrativeAnalysis.R#L1308 -
To my understanding,
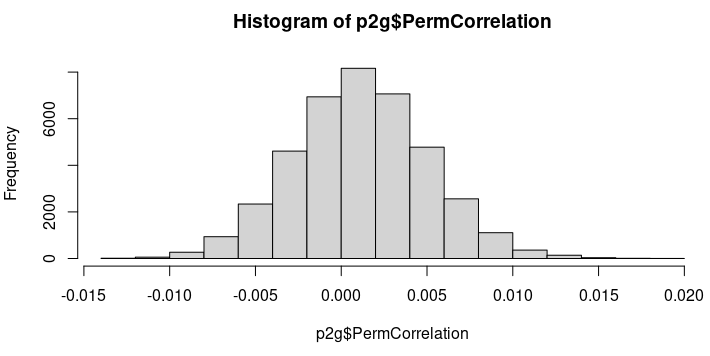
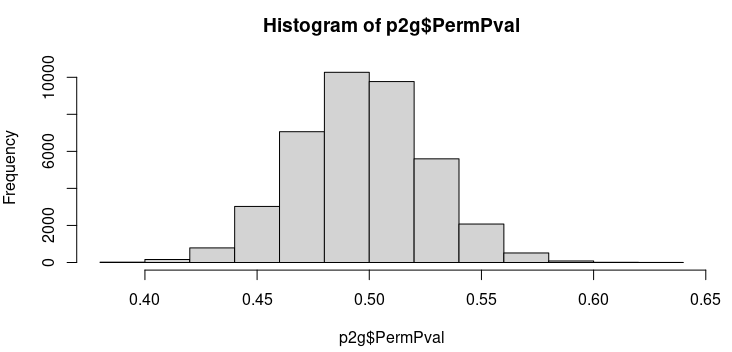
out$PermCorrelationandout$PermPvalrepresent the average null correlation value and average null p-value across all permutations for each peak-to-gene link. Therefore, the histogram ofout$PermCorrelationshould show values tightening up around zero and the histogram ofout$PermPvalshould show a uniform distribution. Can you confirm that this is the case? https://github.com/GreenleafLab/ArchR/blob/25a854ffad5136f44fa7372eb5d35ce7b31d538c/R/IntegrativeAnalysis.R#L1312-L1314 -
To my understanding,
out$PermFDRrepresents FDR-adjusted p-values derived empirically through permutation.ecdf(out$PermPval)(o$Pval)represents the proportion ofout$PermPvalvalues that are less than or equal to each value ofo$Pval.ecdf(o$Pval)(o$Pval)represents the proportion ofo$Pvalvalues that are less than or equal to each value ofo$Pval. When you divide these (ecdf(out$PermPval)(o$Pval)/ecdf(o$Pval)(o$Pval)), you get a set of "FDR-adjusted p-values" derived empircally through permutation. Would you be able to share specific resources or similar implementations of this empirical cumulative distributation function strategy? In other words, has this specific operation been implemented before? https://github.com/GreenleafLab/ArchR/blob/25a854ffad5136f44fa7372eb5d35ce7b31d538c/R/IntegrativeAnalysis.R#L1314
Overall, it seems fairly reasonable to me and will hopefully make the permutation peak-to-gene linkage analysis more accessible to the ArchR community. Thanks for making this possible!
Full disclosure, I didnt write the original p2g code so I'm not 100% sure my interpretation of what you guys are trying to accomplish is accurate. If you have example code that you've used to do this null correlation test, that might be helpful. Answers to your questions below.
Can you confirm that this line in the permutation for loop is necessary? It seems like cdf is not used after the permutation for loop.
Yes I agree - this looks superfluous
To my understanding, out$PermCorrelation and out$PermPval represent the average null correlation value and average null p-value across all permutations for each peak-to-gene link. Therefore, the histogram of out$PermCorrelation should show values tightening up around zero and the histogram of out$PermPval should show a uniform distribution. Can you confirm that this is the case?
This is correct. Though this implementation was my interpretation of what was supposed to be done based on your thread with @AnjaliC4 . So thats not to say that this is the right way to do it but rather how I thought you both wanted it done. Certainly, in looking at the distributions, they are unsurprising.
To my understanding, out$PermFDR represents FDR-adjusted p-values derived empirically through permutation. ecdf(out$PermPval)(o$Pval) represents the proportion of out$PermPval values that are less than or equal to each value of o$Pval. ecdf(o$Pval)(o$Pval) represents the proportion of o$Pval values that are less than or equal to each value of o$Pval. When you divide these (ecdf(out$PermPval)(o$Pval) / ecdf(o$Pval)(o$Pval)), you get a set of "FDR-adjusted p-values" derived empircally through permutation. Would you be able to share specific resources or similar implementations of this empirical cumulative distributation function strategy? In other words, has this specific operation been implemented before?
This FDR calculation is not something I've used myself. I'll see if Jeff can explain.
Thanks @rcorces,
After revisiting this, I have been thinking that it may be more straightforward (from a user's standpoint and from a developer's standpoint) to implement the permutation strategy for calculating empircal p-values rather than the empirical FDR: https://github.com/GreenleafLab/ArchR/discussions/1149#discussioncomment-3908951
This may offer some improvements over the addEmpiricalPval method where chromosomal translocations could become problematic.
addEmpiricalPval | Add empirical p-values based on randomly correlating peaks and genes not on the same seqname.
Hi @rcorces and @RegnerM2015, thanks again for looking into this.
In the current implemented version, it is somewhat strange to me that for p2g linkages where PermPval is not significant, PermFDR seems to be significant. It seems so from the example you posted above @rcorces. I checked it on my end as well.
Hi @AnjaliC4,
PermPval represents the average null p-value across all permutations for each peak-to-gene link while PermFDR represents the actual "FDR adjusted p-value" derived empirically through permutation. Therefore, the PermPval column should have p-values that are not significant (the null hypothesis was induced via permutation). The PermFDR column has p-values that are significant because this is represents the "FDR adjusted p-value" derived empirically through permutation. In short, you would filter results based on PermFDR instead of PermPval.
Hi @RegnerM2015 and @rcorces,
Many thanks for working on this.
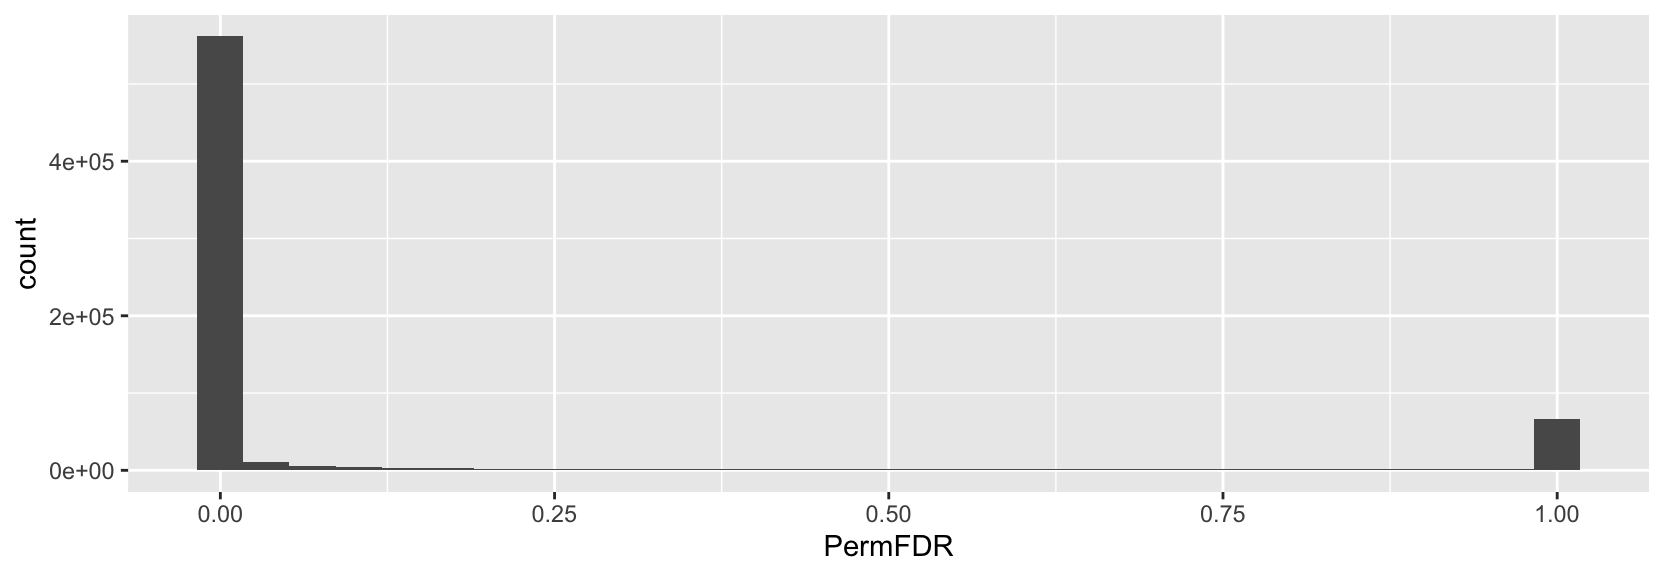
When I run addPeak2GeneLinks with nperm=10, most of the PermFDR values come out as 0 (appears similar to example above). When nperm=100, even more are 0.
Is this expected? PermFDR gives lower values (and many more 0s) than either FDR or EmpFDR.
> Multiproj3_sub_big3 <- addPeak2GeneLinks(
+   ArchRProj = Multiproj3_sub_big3,
+   reducedDims = "Harmony_ATAC",
+   useMatrix = "GeneExpressionMatrix",
+   cellsToUse = NULL,
+   addEmpiricalPval = T,
+   addPermutedPval = T,
+   nperm = 10,
+   maxDist = 500000)
ArchR logging to : ArchRLogs/ArchR-addPeak2GeneLinks-3031bb30320-Date-2023-01-05_Time-09-02-35.log
If there is an issue, please report to github with logFile!
2023-01-05 09:02:35 : Getting Available Matrices, 0.002 mins elapsed.
2023-01-05 09:02:35 : Filtered Low Prediction Score Cells (0 of 9147, 0), 0.003 mins elapsed.
2023-01-05 09:02:36 : Computing KNN, 0.009 mins elapsed.
2023-01-05 09:02:36 : Identifying Non-Overlapping KNN pairs, 0.01 mins elapsed.
2023-01-05 09:02:38 : Identified 497 Groupings!, 0.043 mins elapsed.
2023-01-05 09:02:38 : Getting Group RNA Matrix, 0.045 mins elapsed.
2023-01-05 09:03:25 : Getting Group ATAC Matrix, 0.826 mins elapsed.
2023-01-05 09:04:51 : Normalizing Group Matrices, 2.26 mins elapsed.
2023-01-05 09:04:56 : Finding Peak Gene Pairings, 2.344 mins elapsed.
2023-01-05 09:04:57 : Computing Correlations, 2.366 mins elapsed.
2023-01-05 09:05:03 : Computing Background Correlations, 2.466 mins elapsed.
Performing Permuted P-values similar to Regner et al., 2021
Running Permutation 1 of 10
Running Permutation 2 of 10
Running Permutation 3 of 10
Running Permutation 4 of 10
Running Permutation 5 of 10
Running Permutation 6 of 10
Running Permutation 7 of 10
Running Permutation 8 of 10
Running Permutation 9 of 10
Running Permutation 10 of 10
2023-01-05 09:06:39 : Completed Peak2Gene Correlations!, 4.058 mins elapsed.
ArchR logging successful to : ArchRLogs/ArchR-addPeak2GeneLinks-3031bb30320-Date-2023-01-05_Time-09-02-35.log

> p2g.links <- getPeak2GeneLinks(
+   ArchRProj = Multiproj3_sub_big3,
+   corCutOff = 0,
+   FDRCutOff = 1,
+   varCutOffATAC = 0.5,
+   varCutOffRNA = 0.5,
+   returnLoops = F)

> p2g <- as.data.frame(p2g.links)
> head(p2g)
  idxATAC idxRNA Correlation          FDR  VarQATAC   VarQRNA   EmpPval    EmpFDR PermCorrelation  PermPval PermFDR
1       4     15 0.185606904 0.0001500642 0.5052618 0.7584939 0.2491308 0.9999992    -0.019281929 0.5299559       0
2       5     15 0.175488034 0.0003669731 0.8886250 0.7584939 0.2763391 0.9999992    -0.010771511 0.5669854       0
3       6     15 0.112761814 0.0294534878 0.5160244 0.7584939 0.4885768 0.9999992    -0.026448861 0.3526380       0
4       7     15 0.007616294 0.9089375874 0.8863805 0.7584939 0.9770522 0.9999992     0.002711997 0.5730485       1
5      10     15 0.100632180 0.0552493131 0.6744967 0.7584939 0.5378966 0.9999992     0.005727776 0.5194825       0
6      23     15 0.128458381 0.0117864114 0.7447596 0.7584939 0.4285529 0.9999992     0.031439943 0.4041811       0
> ggplot(p2g, aes(x=PermFDR)) + geom_histogram()
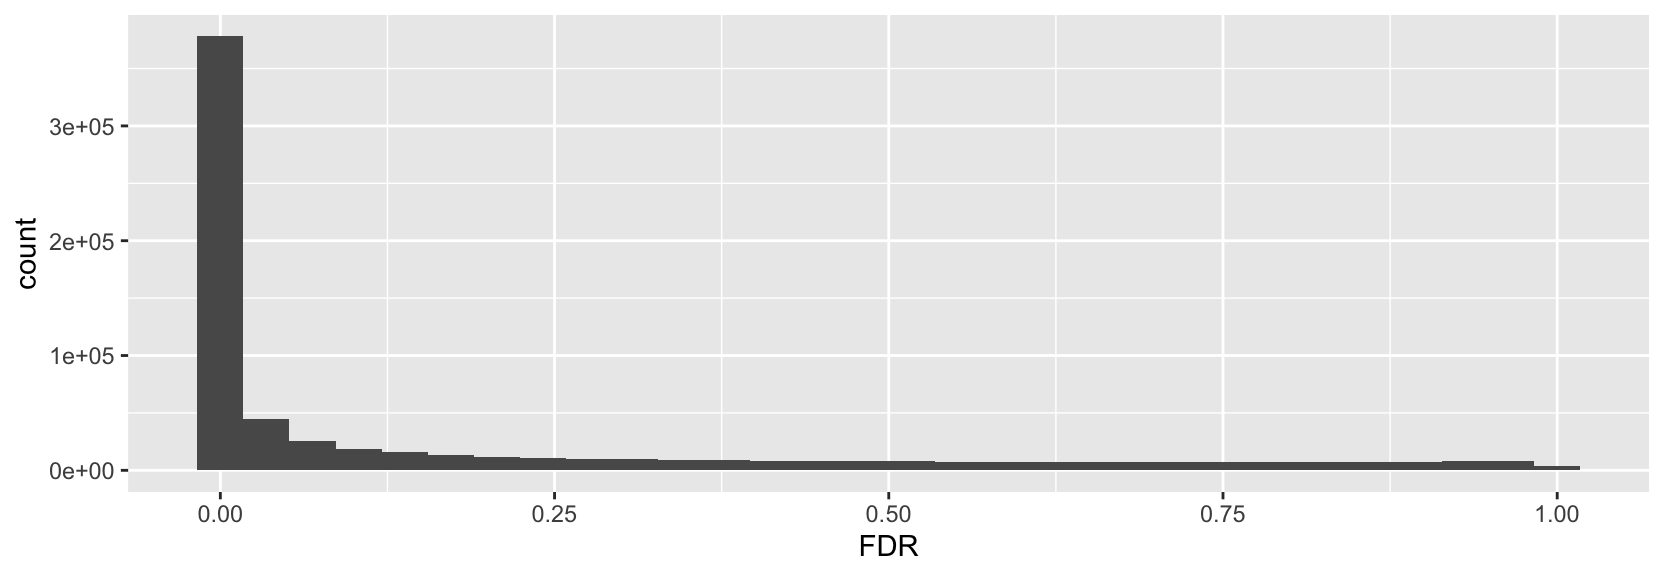
> ggplot(p2g, aes(x=FDR)) + geom_histogram()
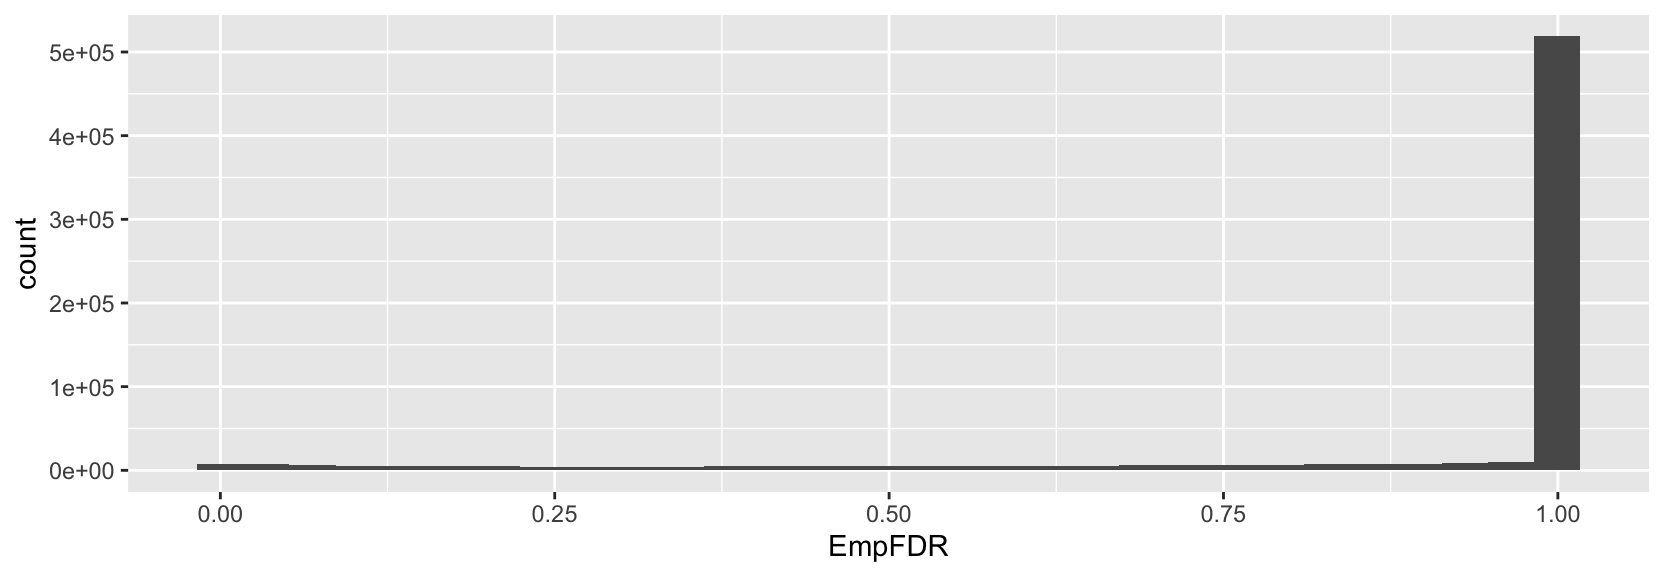
> ggplot(p2g, aes(x=EmpFDR)) + geom_histogram()
Hi @jblich870,
The large amount of zeros that you observing (relative to the other methods) could be due to a variety of factors (related to this specific PermFDR implementation and/or related to your data). However, I would expect this PermFDR implementation to return lower values compared to FDR in some cases, but not to the degree that you demonstrate. As far as the PermFDR v. EmpFDR goes, I am not sure about this comparison.
For the histograms, my thoughts are below:
-
The bimodal pattern of PermFDR seems interesting and is probably due to how the PermFDR is calculated with
pmin(): https://github.com/GreenleafLab/ArchR/blob/25a854ffad5136f44fa7372eb5d35ce7b31d538c/R/IntegrativeAnalysis.R#L1312-L1314pmin()returns the lowest value of the two to my understanding. In this case, the value of PermFDR is eitherecdf(out$PermPval)(o$Pval) / ecdf(o$Pval)(o$Pval)or1. Based on my interpretation,ecdf(out$PermPval)(o$Pval) / ecdf(o$Pval)(o$Pval)often yields 0 in your situation and rarely produces values between 0 and 1. -
The FDR histogram looks as expected with a high enrichment of low p-values.
-
For the EmpFDR histogram, it seems that the multiple testing correction was relatively strict given the high enrichment of large p-values near 1. Could you show the histogram of EmpPval before the multiple testing correction was applied?
I will say that it could be helpful to set the varCutOffATAC and varCutOffRNA params to 0 in getPeak2GeneLinks() so that you return the entire distribution of p-values. Right now, the histograms are leaving out peak-to-gene link tests with varCutOffATAC and varCutOffRNA values <0.5.
Hi @RegnerM2015,
Many thanks for your reply. Do you think then that the PermFDR calculation is not optimal in its current form?
As for the EmpFDR values, I just plotted the output of addPeak2GeneLinks with addEmpiricalPval = T, I am unsure how it is calculated.
It is tough to comment on how optimal the PermFDR calculation is, but I would say it is still undergoing development here.
@rcorces @jeffmgranja what are your thoughts on the current FDR calculations in addPeak2GeneLinks?
Is the multiple testing correction for the current EmpFDR implementation too strict and if so, is there are way to relax it?
In general what would you suggest is the best way to triage peak 2 gene links to get towards potential regulatory relationships? (e.g. correlation, varianceRNA/ATAC and FDR/EmpFDR cutoffs?)