Rollup Columns should be disabled by default
What
Rollup Columns should be disabled by default on all visualisation types, including data tables.
Why
When performing an aggregation, the option Rollup Columns is enabled by default, on all visualisation types. This option adds a sum count of all events as a column.
Why Rollup Columns should be disabled by default
Rollup Columns being enabled by default on all visualisation types is not intuitive. It makes many visualisation types output unreadable or useless results. The interface does not visually make it clear that this column is different from the others in nature resulting in user confusion. When the user specifies exactly what aggregation they need to see in a piechart, they quite reasonably do not then expect 50% of the piechart area to represent the sum of the other 50%!
An experienced Graylog user will reflexively uncheck this option when creating dashboard elements - I have not yet found a use case where I want it enabled. The only case where I can see this option being a desirable default is in data tables, and even then, I don't think it should be enabled by default. The purpose of a default is to save the user from taking an action a majority of the time. Currently, the user is required to disable this opton the majority of the time - which to me suggests the current default is wrong.
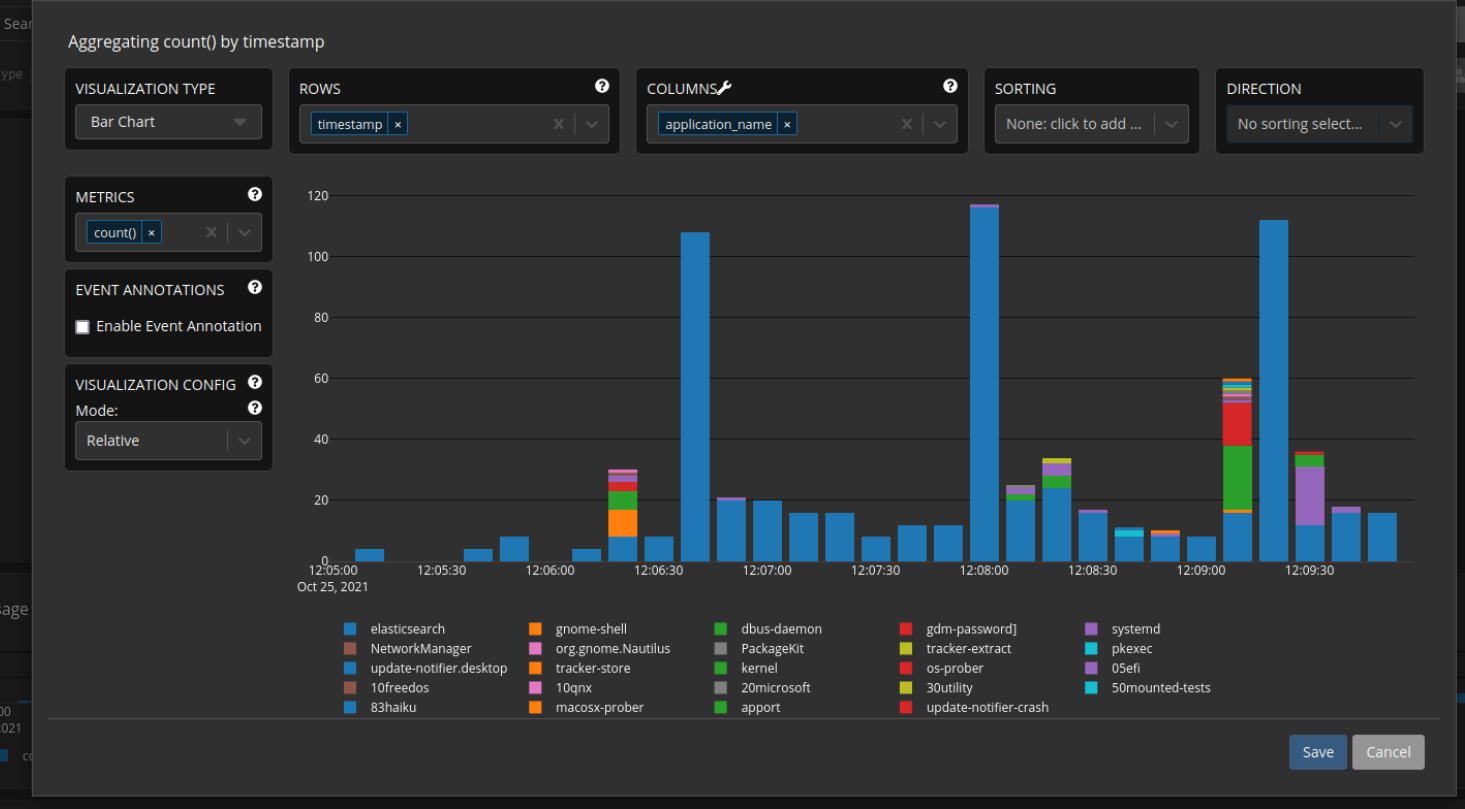
rollup:
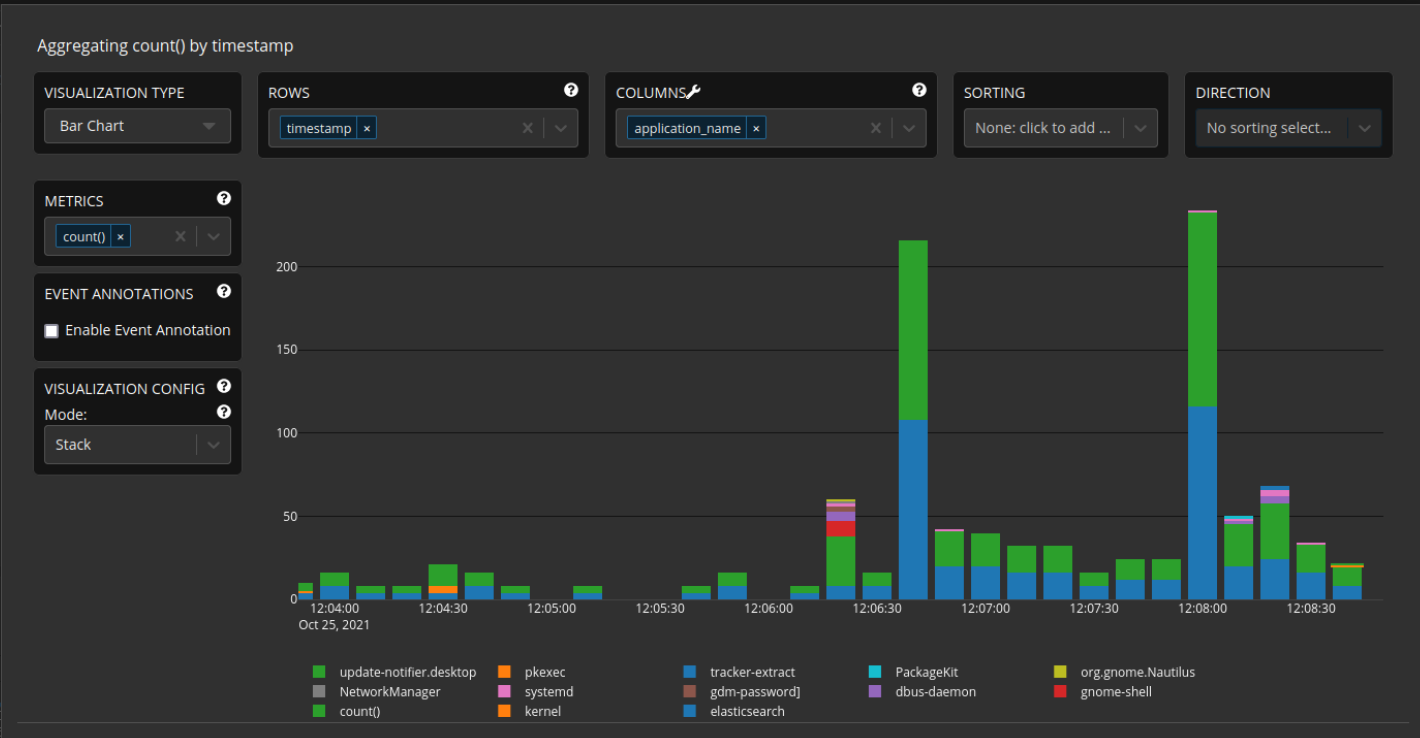
same data, no rollup: