the debugger starts with nothing happening
hello, I've been trying to use VSCode to write and debug java. However after I set up the configuration and click the debug button, nothing happened.
Here are pictures about the problem. The first one shows my configuration and the second one shows the state after I clicked the debug button. Please ignore the folder named "1".


Even if I change the startup class into a non-exist class the debugger still remains the same and throw no error. Any body can help me? Lots of thanks!
Sometimes this happens, I just stop the debugger and run again.
Could be that java debug server is waiting for connection.
@gylidian this eventually happens, just try to reload your editor and debug again.
mine is working as expected.

@faustinoaq I am just a junior middle school student;During these several days,I am always confused with this problem. My vscode can only run,but cannot debug. Follow your saying,after reload,nothing changed.
This is my launch.json
{ "version": "0.2.0", "configurations": [{ "name": "Java", "type": "java", "request": "launch", "stopOnEntry": true, "jdkPath": "D:/Java/jdk1.8.0_144/bin", "cwd": "${fileDirname}", "startupClass": "${fileBasenameNoExtension}", "classpath": [ ".", "${fileDirname}" ] }, { "name": "Java Console App", "type": "java", "request": "launch", "stopOnEntry": true, "jdkPath": "${config:java.home}/bin", "cwd": "${fileDirname}", "startupClass": "${fileBasenameNoExtension}", "classpath": [ ".", "${fileDirname}" ], "externalConsole": true } ] }
I want to cry
Your launch.json looks good, I don't know what could be the problem :sweat_smile:
Yeah, It is a known issue.
I don't know what why it happens. Also is a bug hard to reproduce.
your jdk language is not english
Maybe you can try a machine completely in English :sweat_smile:
@faustinoaq Hi, faustinoaq , I have encountered this issue too. After days of searching in github.com | visualstudio.com | stackoverflow.com , and now ...... I hate this issue ...... If you would, please give a intelij OR eclipse simple HelloWorld sample, which have project structure and vs code settings(settings.json tasks.json launch.json ), thank you very much
I recommend you Intellij or Eclipse because they are more friendly and work out the box. :sweat_smile:
VSCode is a bit messy, because you need to figureout about bugs, misconfigurations, enviroments, etc. So I'm able to debug using this plugin, but it sometimes doesn't fit my requirements.
VSCode is better for JavaScript/Typescript, and other languages without an IDE. However Java is widely supported by almost every good IDE (Intellijj, Eclipse, Netbeans, etc).
@faustinoaq Yes, you are right. I just want to edit all of languages in one place, and open too much window is so complex. But finally, Intelij or eclipse is better. Also vs code can edit python, but when I want to develop program nor script, I will use pyCharm. (what I said just looks like a jet brain's Ad, ^_^ )
@faustinoaq I have tried restart or reload for several times, but nothing changed

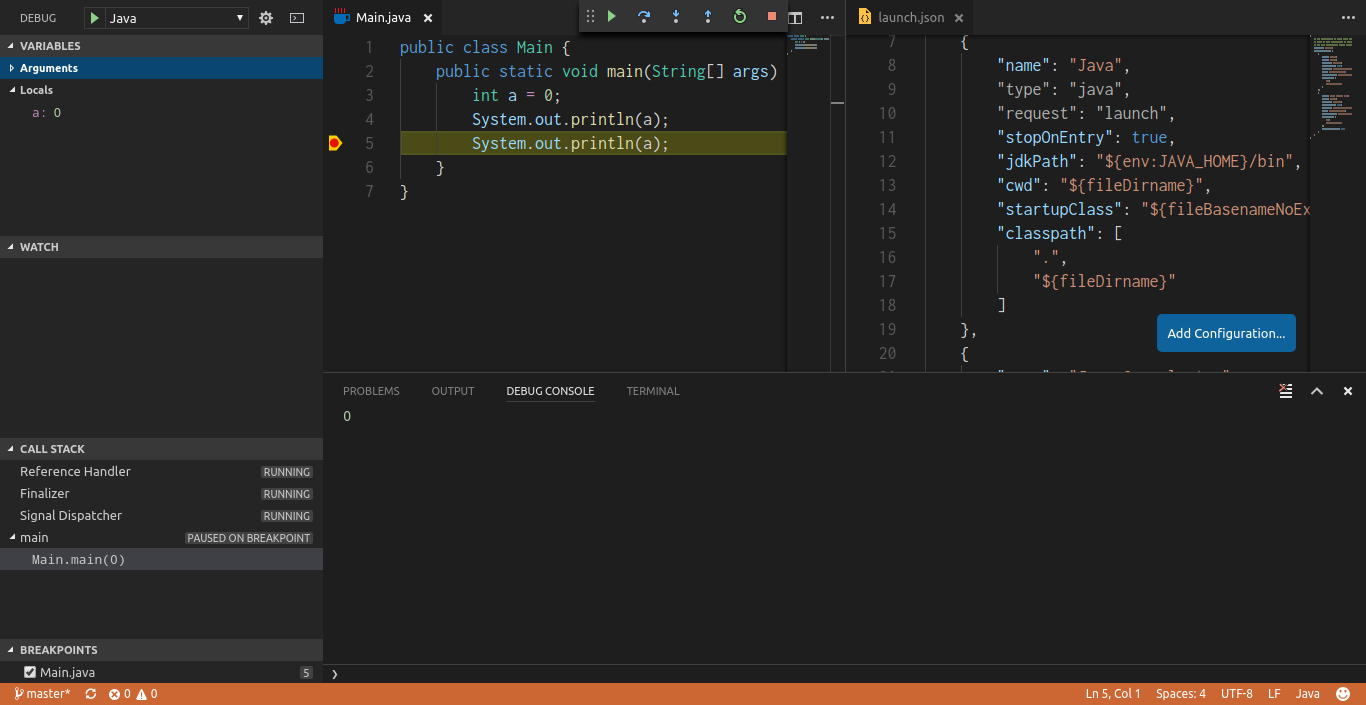
Currenlty I'm able to debug using the latest version of this extension:
I don't know what would be happening with you configuration :sweat_smile:
@faustinoaq I set the launch.json same as yours, but still failed. the stepin stepout button I never have seen them become clickable. and the first green button, it always grey or a blue pause icon.
@LimnN I don't know what would be happening, but If VSCode don't work for you, try Intellij Idea or Eclipse because they have better support for java debugging out-the-box :sweat_smile: