calculate_alive_path / plot_history_alive probabilities almost always equal to 1
Hello!
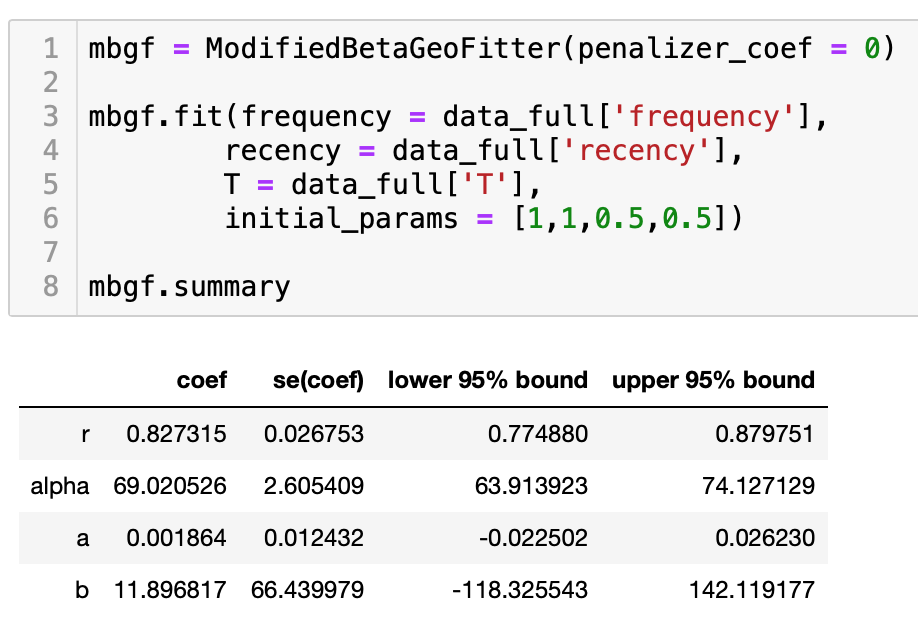
I am following the steps taking by: https://towardsdatascience.com/whats-a-customer-worth-8daf183f8a4f with the same data set. However, for the probabilities of being alive I only get values of 1, instead of the expected behaviour of slowly 'dying' after their last purchase. I used the following model:
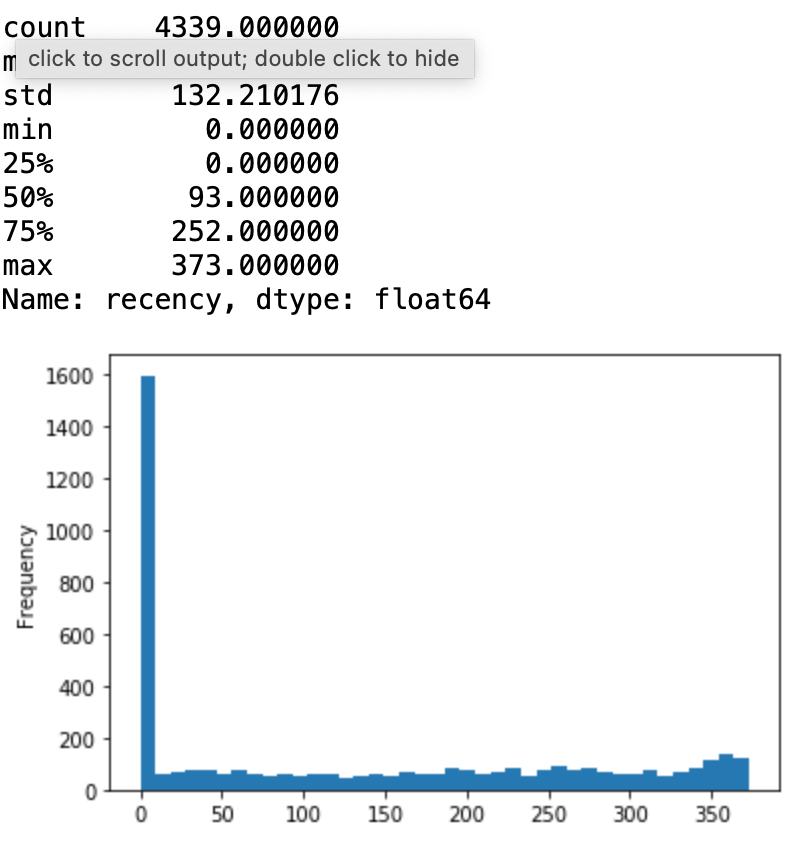
 I do have many 1-time purchases, as can be seen from the recency histogram.
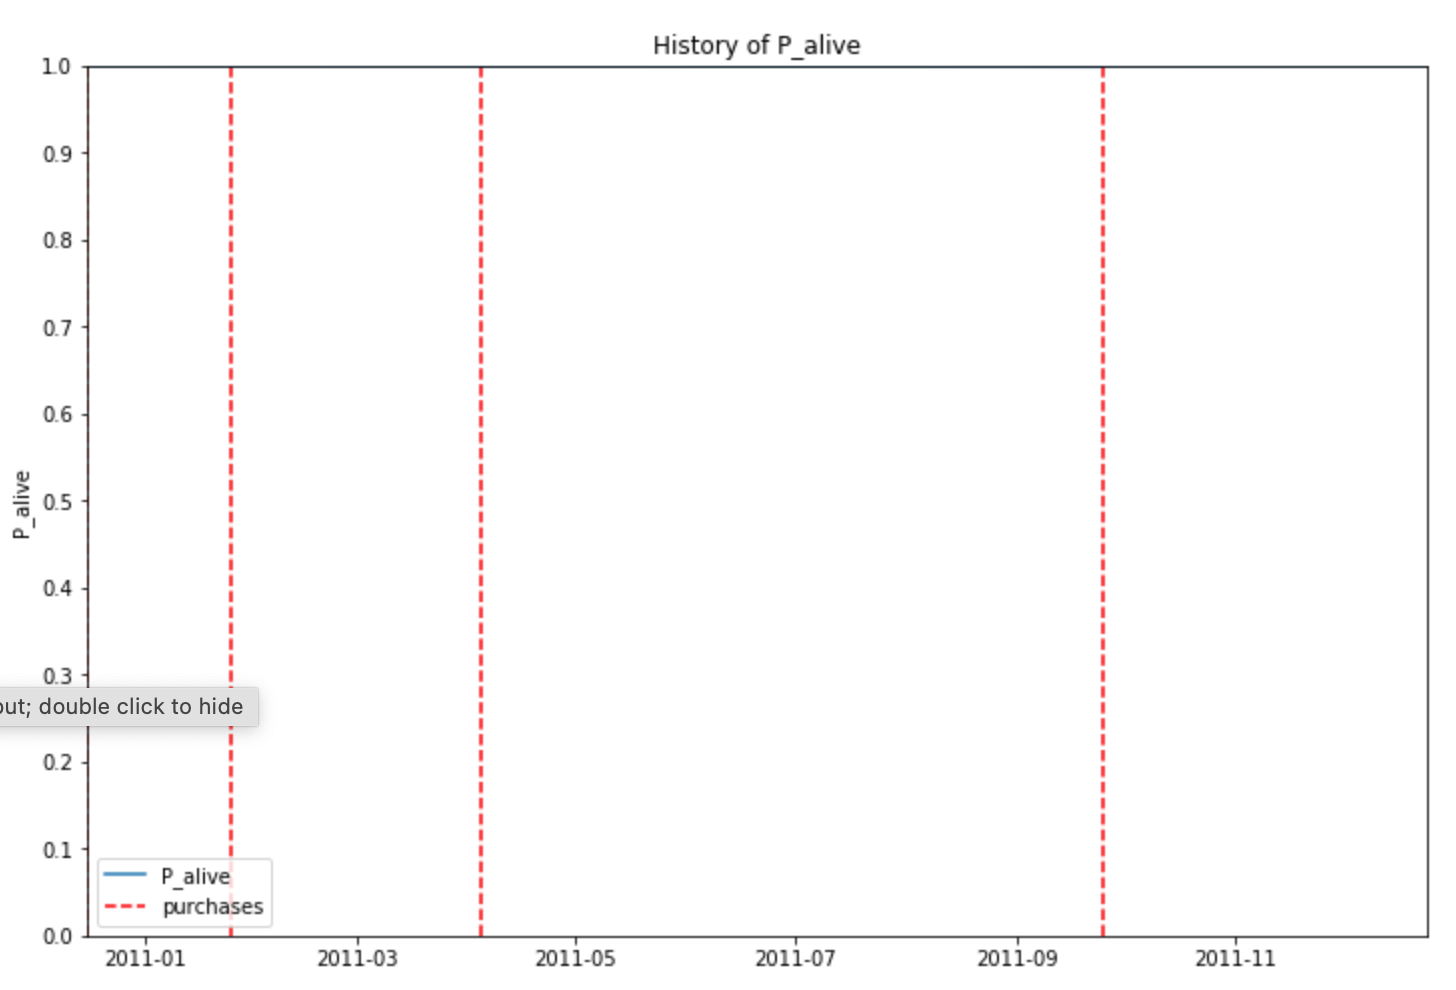
 All the plot_history_alive graphs I get look like:
 Does someone know how this happens and why I get different results from TowardsDataScience with exactly the same steps and data?
Thank you in advance!
Hi, I have exactly the same problem. I think that this is an error. I hacked it by adding 'facked' 2nd transaction into the dataframe with exactly the same date as the first-time transaction. Then it follows the curve of dying alive probability.
I am currently looking into the source code to better understand.
BTW: There is yet another problem I have not understood. The alive probability is starting at ~65% which for me is not reflecting any intuition. It should start at 100% and quickly fall to lower levels as intuitively understood. If you have any comments on this, I welcome them very much